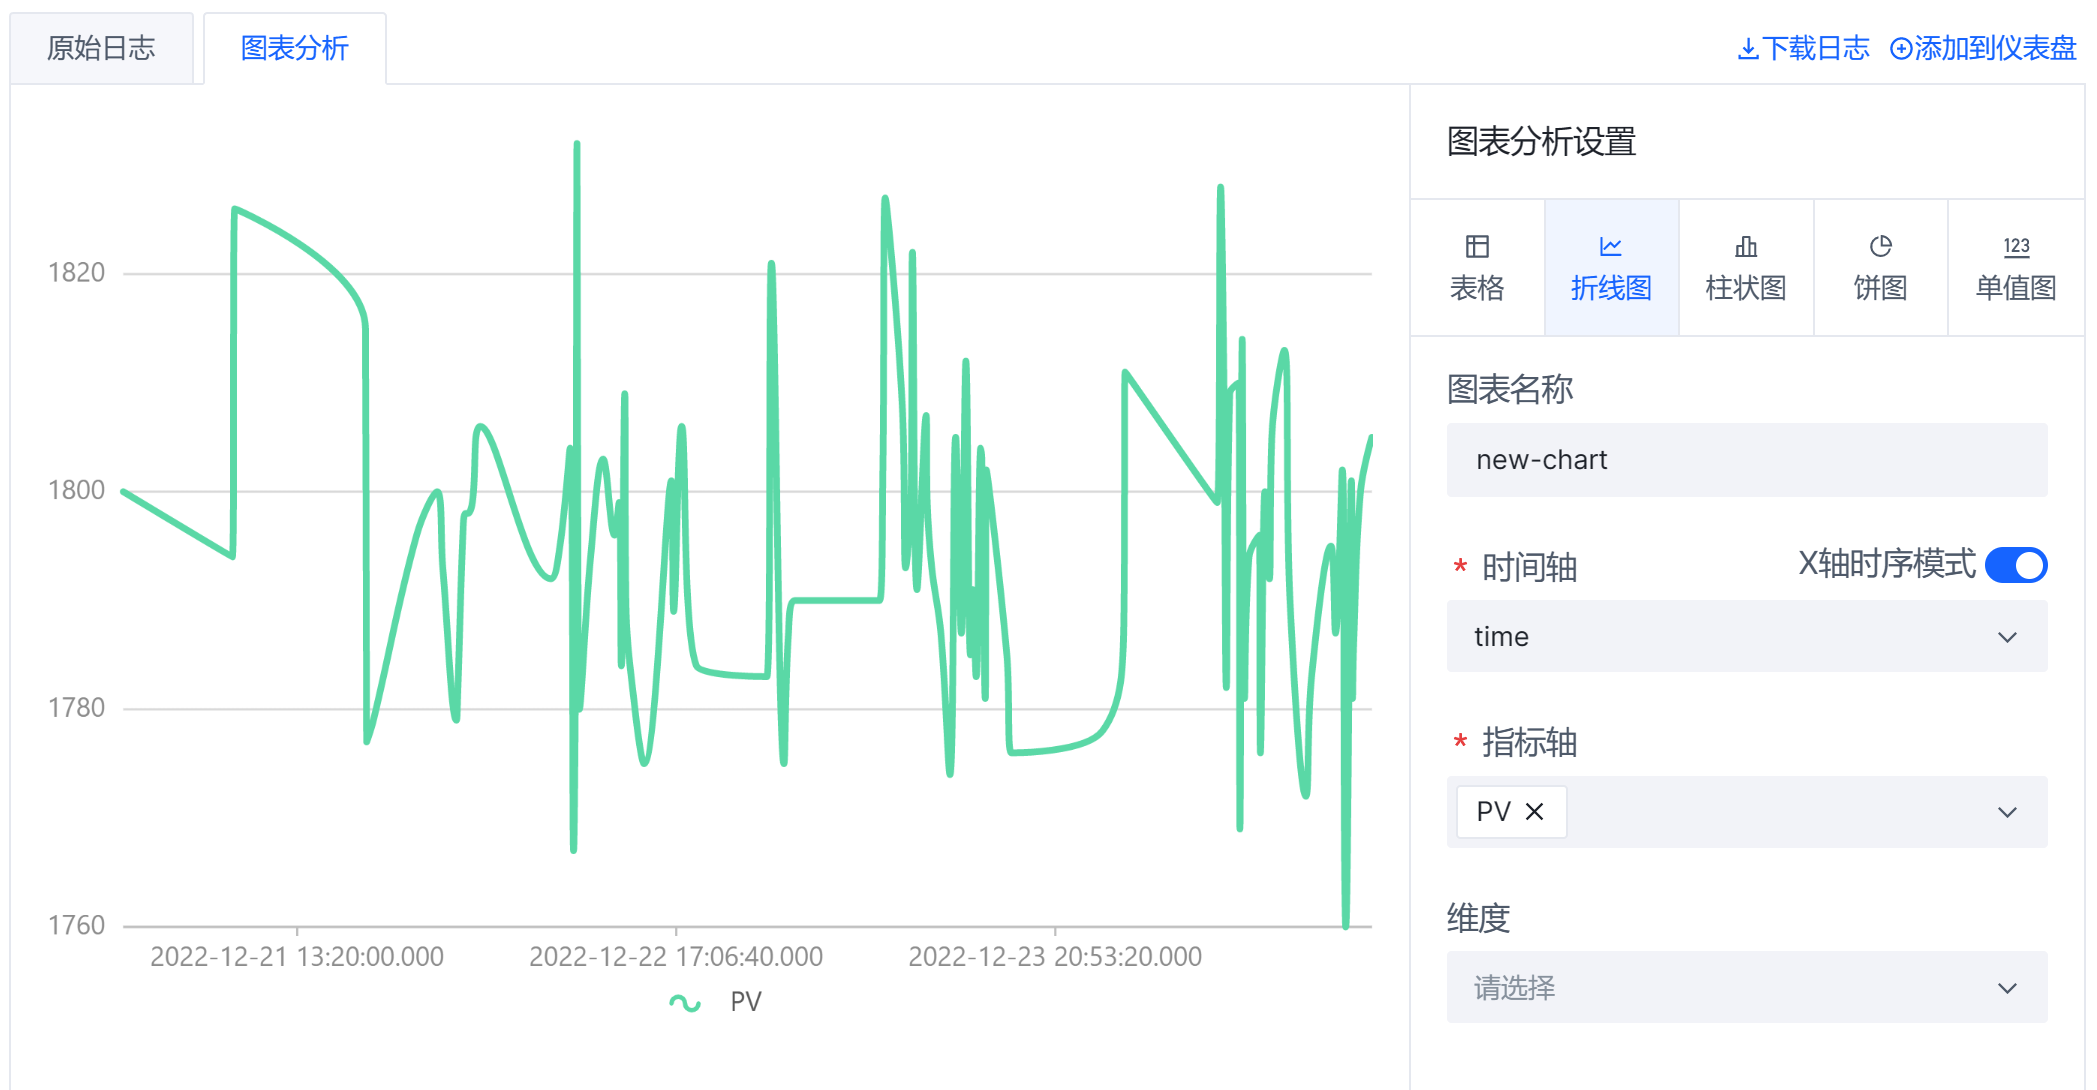
本文档提供了日志检索的示例。这些示例可以帮助您了解如何检索日志。您可以查看文档目录浏览以及跳转到相应的示例。
在您检索日志时,需要了解检索语法。检索语句由查询语句和分析语句两部分组成,格式是 <查询语句>|<分析语句>。分析语句是可选的。本文档不会对检索语法进行阐述,而是通过示例演示常见的检索语法。关于更多日志检索的语法以及您可以在检索语句中使用的函数,参见 日志分析概述。
如果您配置了将检索结果以图表展示,您可以将图表添加到仪表盘,方便您查看图表。参见 仪表盘。
对于示例中使用的日志字段的描述,参见 日志字段说明。
前提条件
要使用本文档的示例,您需要完成以下操作:
指定时间范围
在 检索分析 页面,点击日历图标指定一个时间范围。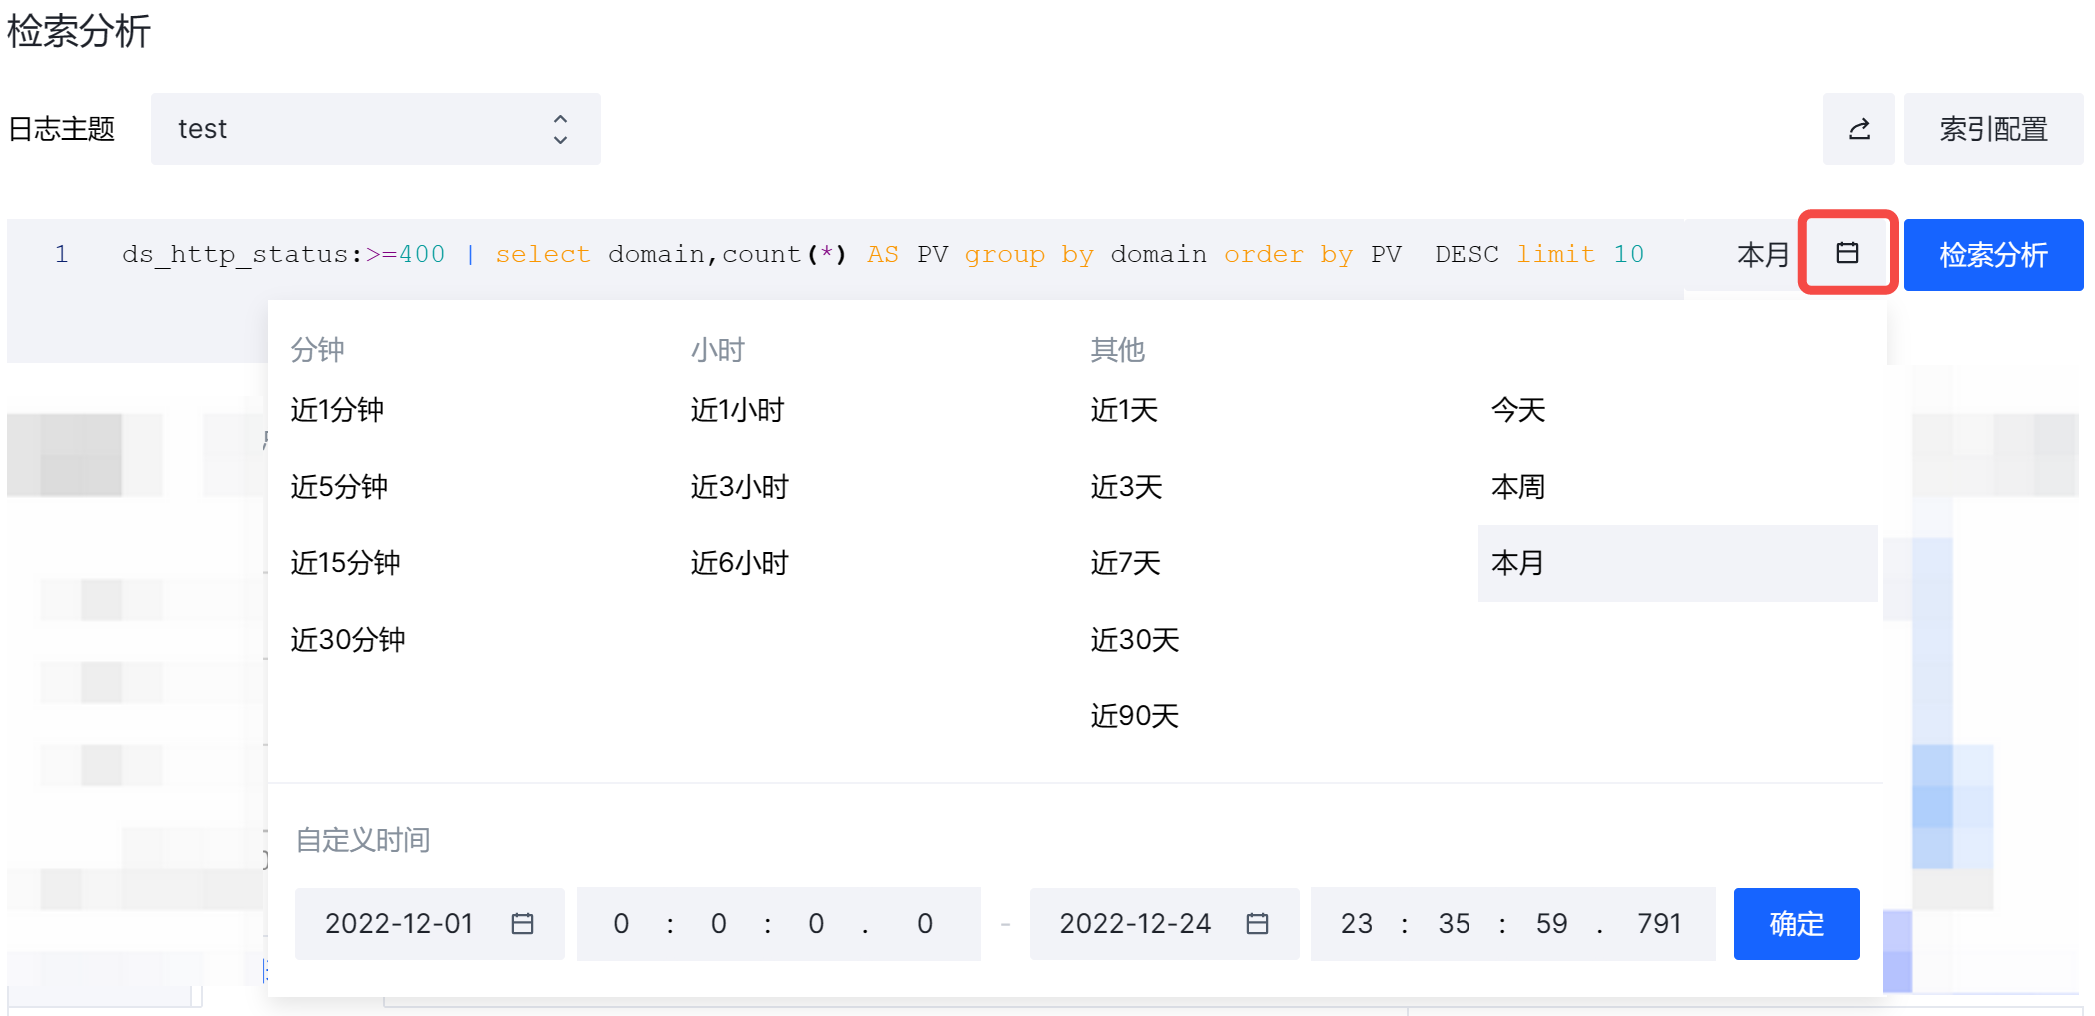
更新索引配置
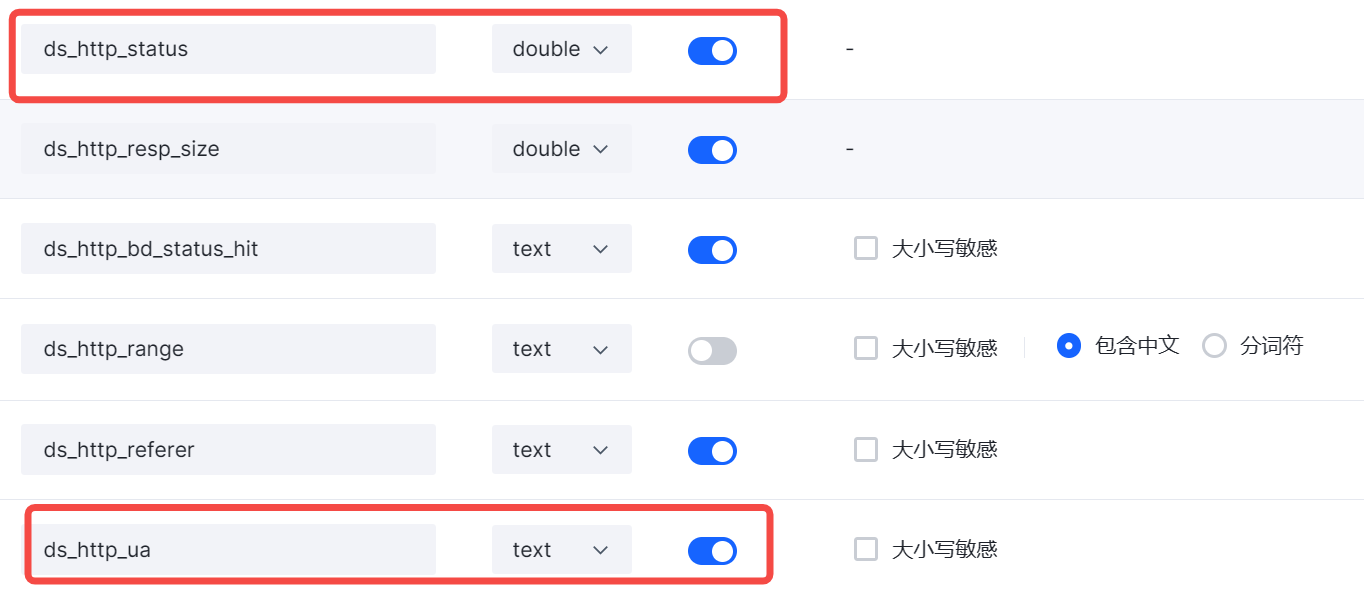
您需要对日志主题的索引配置做以下更新:
- 启用对
ds_http_ua的索引。该字段记录的是 User-Agent 头部值。 - 设置
ds_http_status的字段类型为double。
在您更新索引配置后,日志主题中新投递的日志就会使用更新后的索引配置。
要修改索引配置,遵循以下步骤:
- 在 实时日志 标签页,找到您需要修改索引配置的日志主题。
- 在 操作 列,点击 检索。

- 在 检索分析 页面,点击 索引配置。

- 设置 ds_http_status 的字段类型为 double,然后设置 ds-http_ua 为启用。
- 点击 确定 保存修改。
关于日志服务中索引的详细介绍,参见 配置索引。
查询满足指定条件的日志
获取指定状态码的用户请求
需求:
- 获取 CDN 响应状态码是 500 的用户请求。
检索语法:
ds_http_status:500
检索结果截图: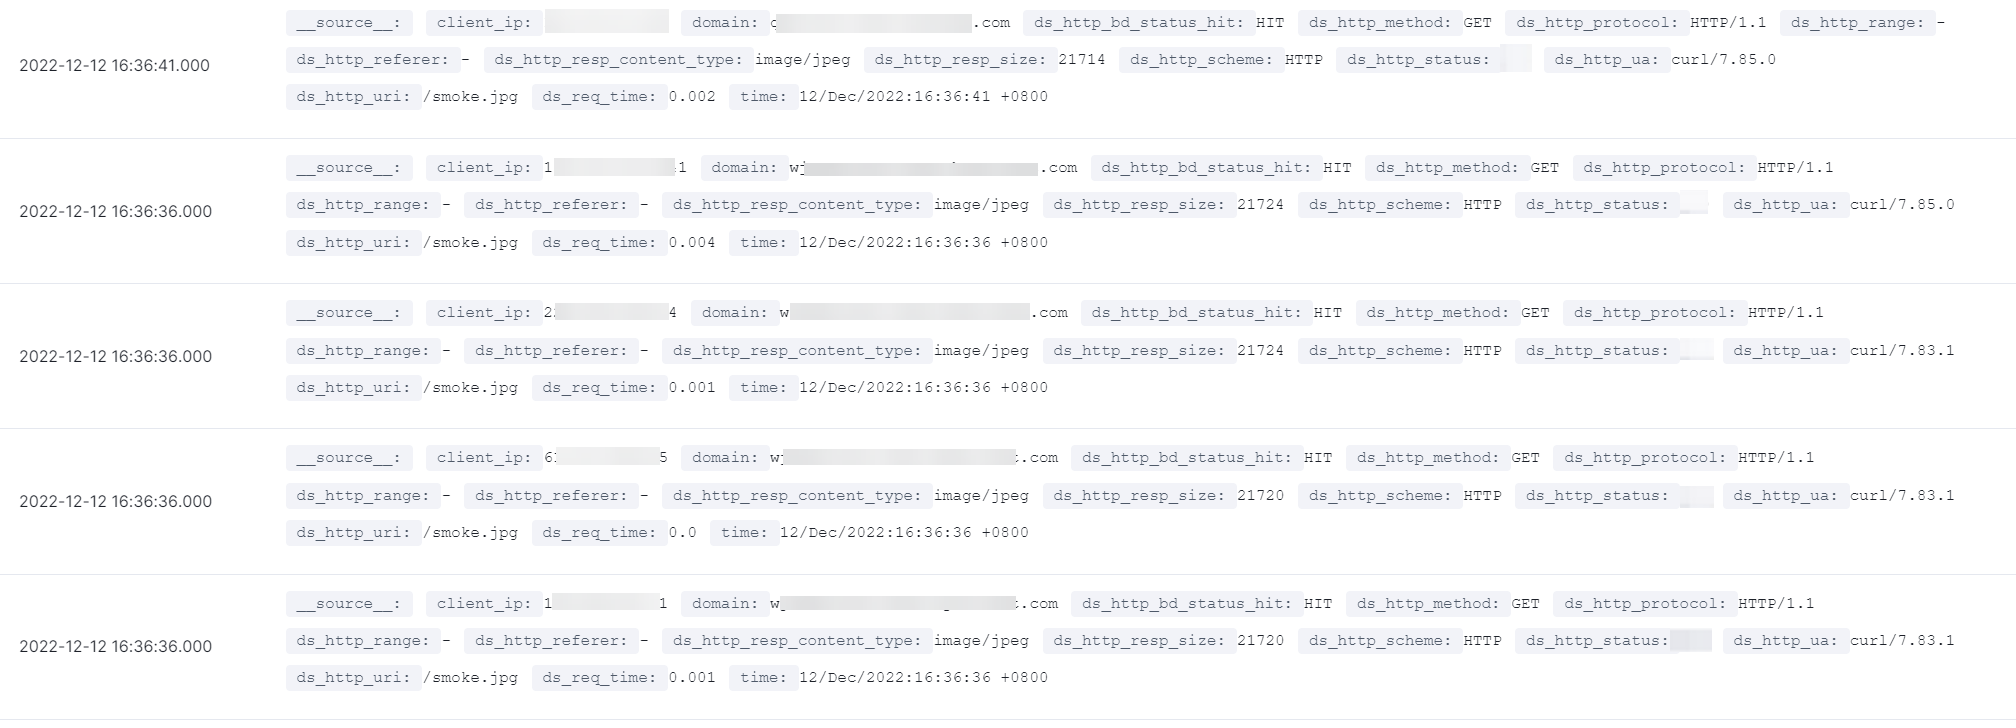
获取响应慢的用户请求
需求:
- 检索响应时长大于 1 秒的用户请求。
检索语法:
ds_req_time:>=1
检索结果截图:
获取对指定 URL 的用户请求
需求:
- 获取对指定 URL 的用户请求。
检索语法:
ds_http_uri: "/smoke.jpg"
检索结果截图:
监测 CDN 的请求错误
统计 TOP 域名
需求:
- 获取请求错误数量最多的 10 个域名。
检索语法:
ds_http_status:>=400 | select domain,count(*) AS PV group by domain order by PV DESC limit 10
检索结果展示:表格
检索结果截图: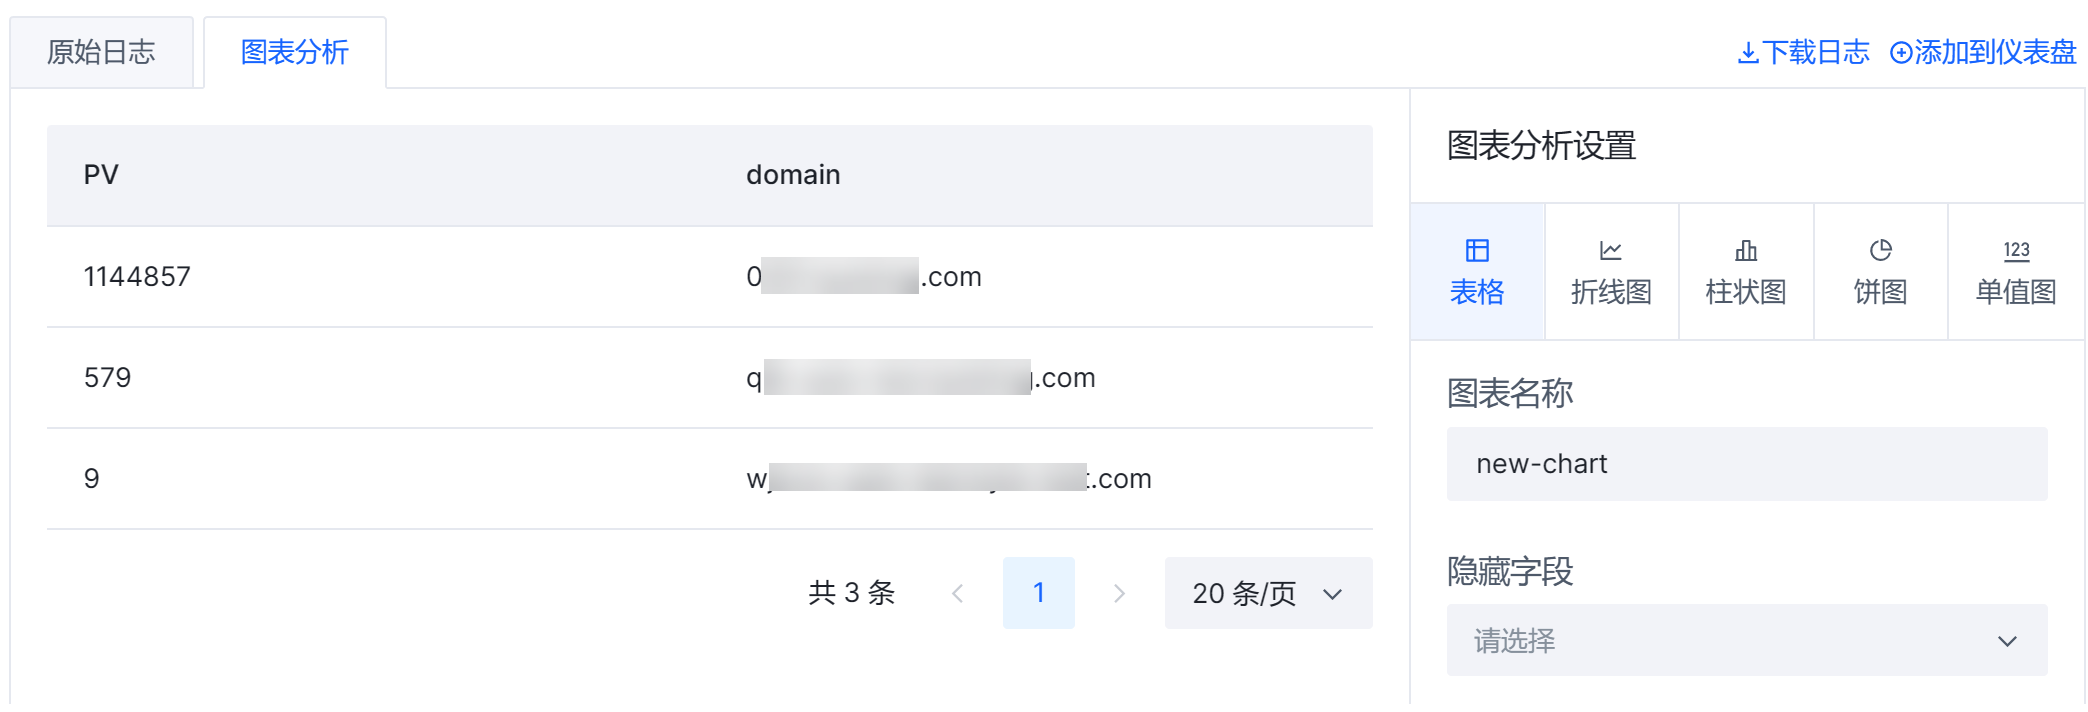
统计 TOP URL
需求:
- 获取请求错误数量最多的 10 个 URL。
检索语法:
ds_http_status:>=400 | select ds_http_uri,count(*) AS PV group by ds_http_uri order by PV DESC limit 10
检索结果展示:饼图
检索结果截图: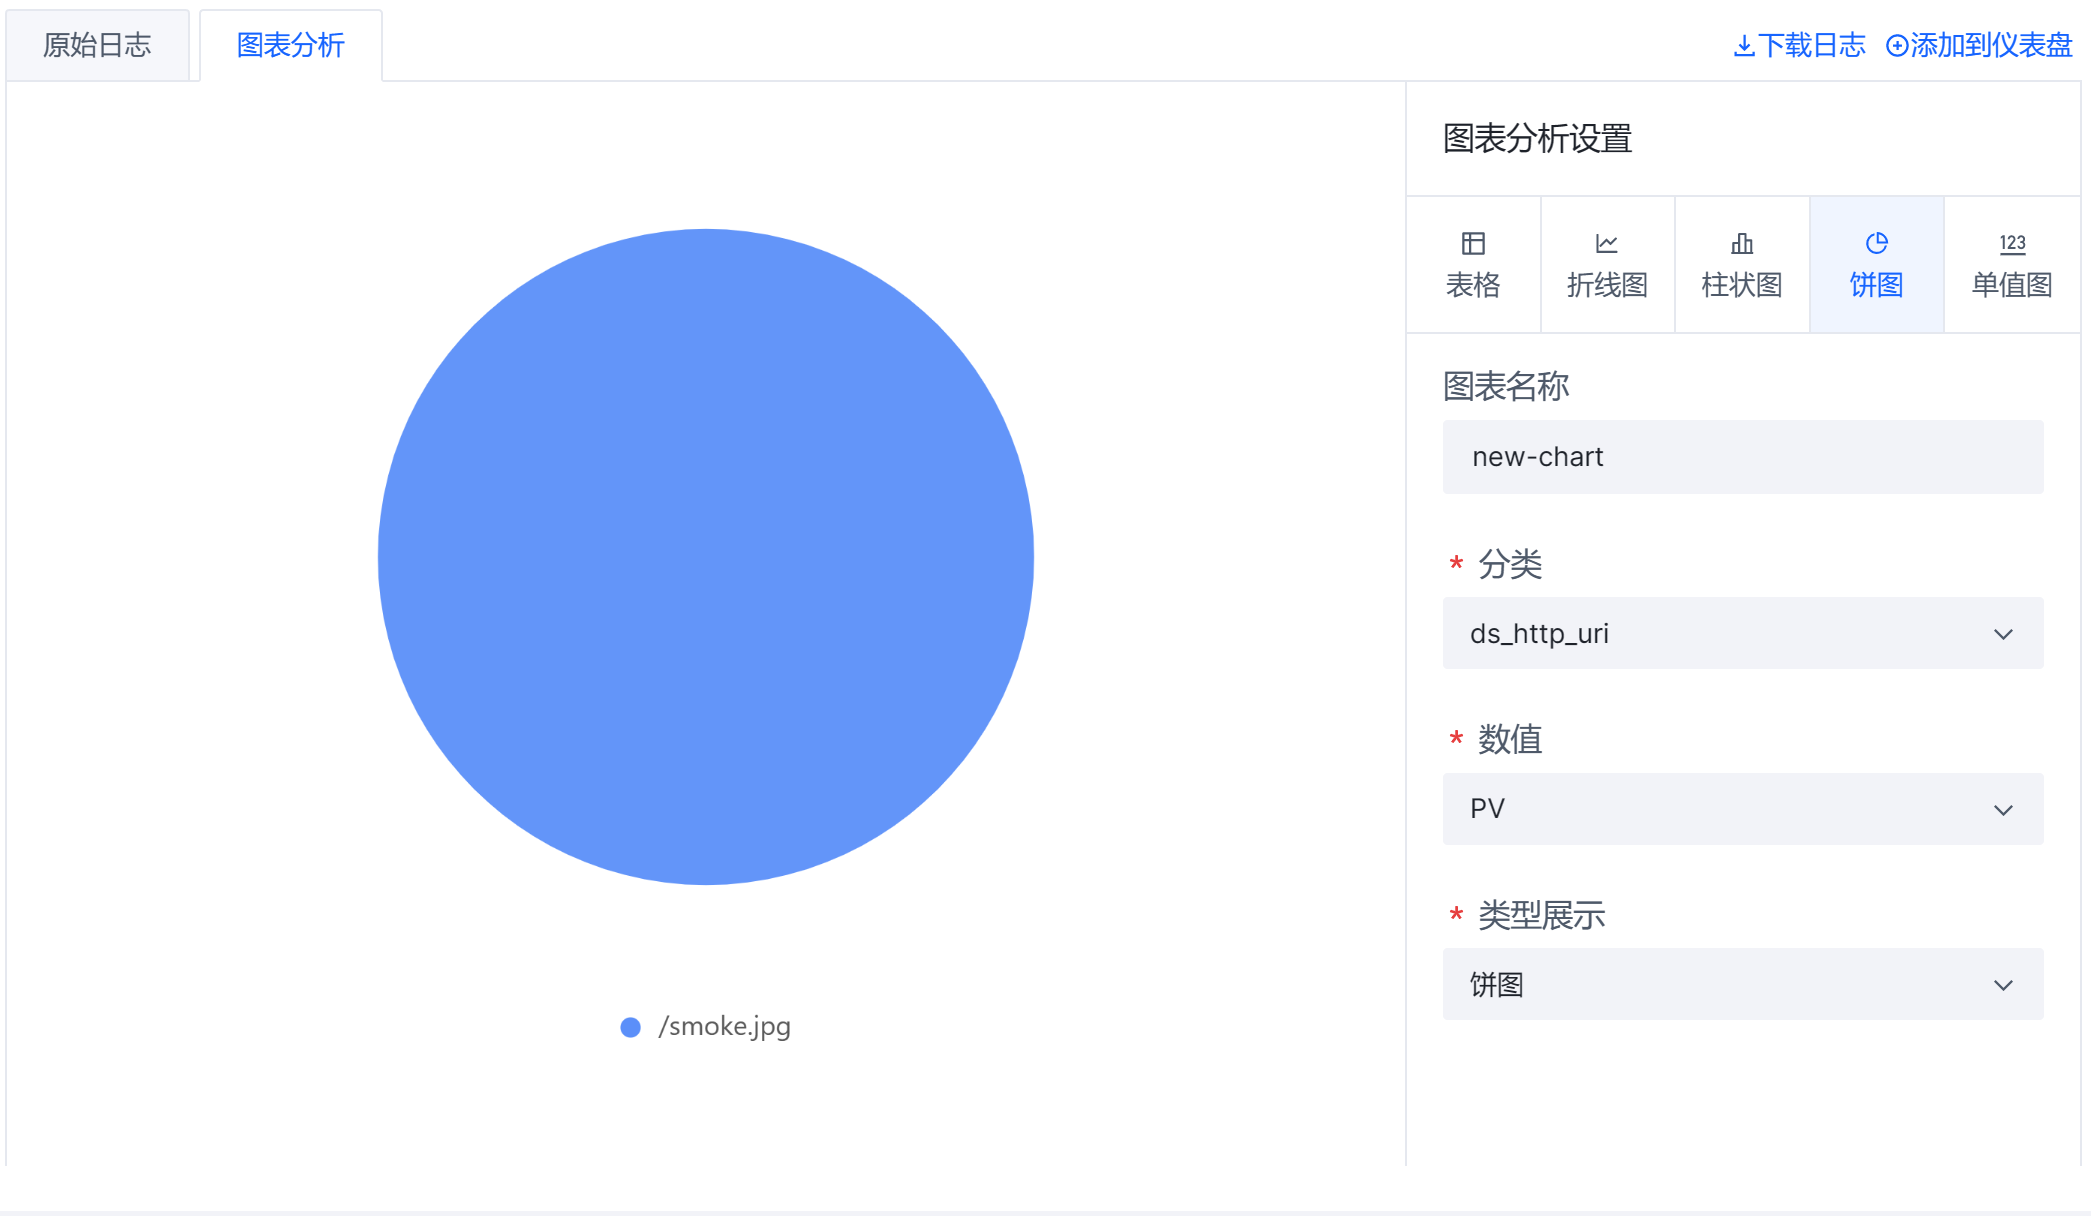
统计 TOP UA
需求:
- 获取请求错误数量最多的 10 个 User-Agent。
检索语法:
ds_http_status:>=400 | select ds_http_ua,count(*) AS PV group by ds_http_ua order by PV DESC limit 10
检索结果展示:饼图
检索结果截图: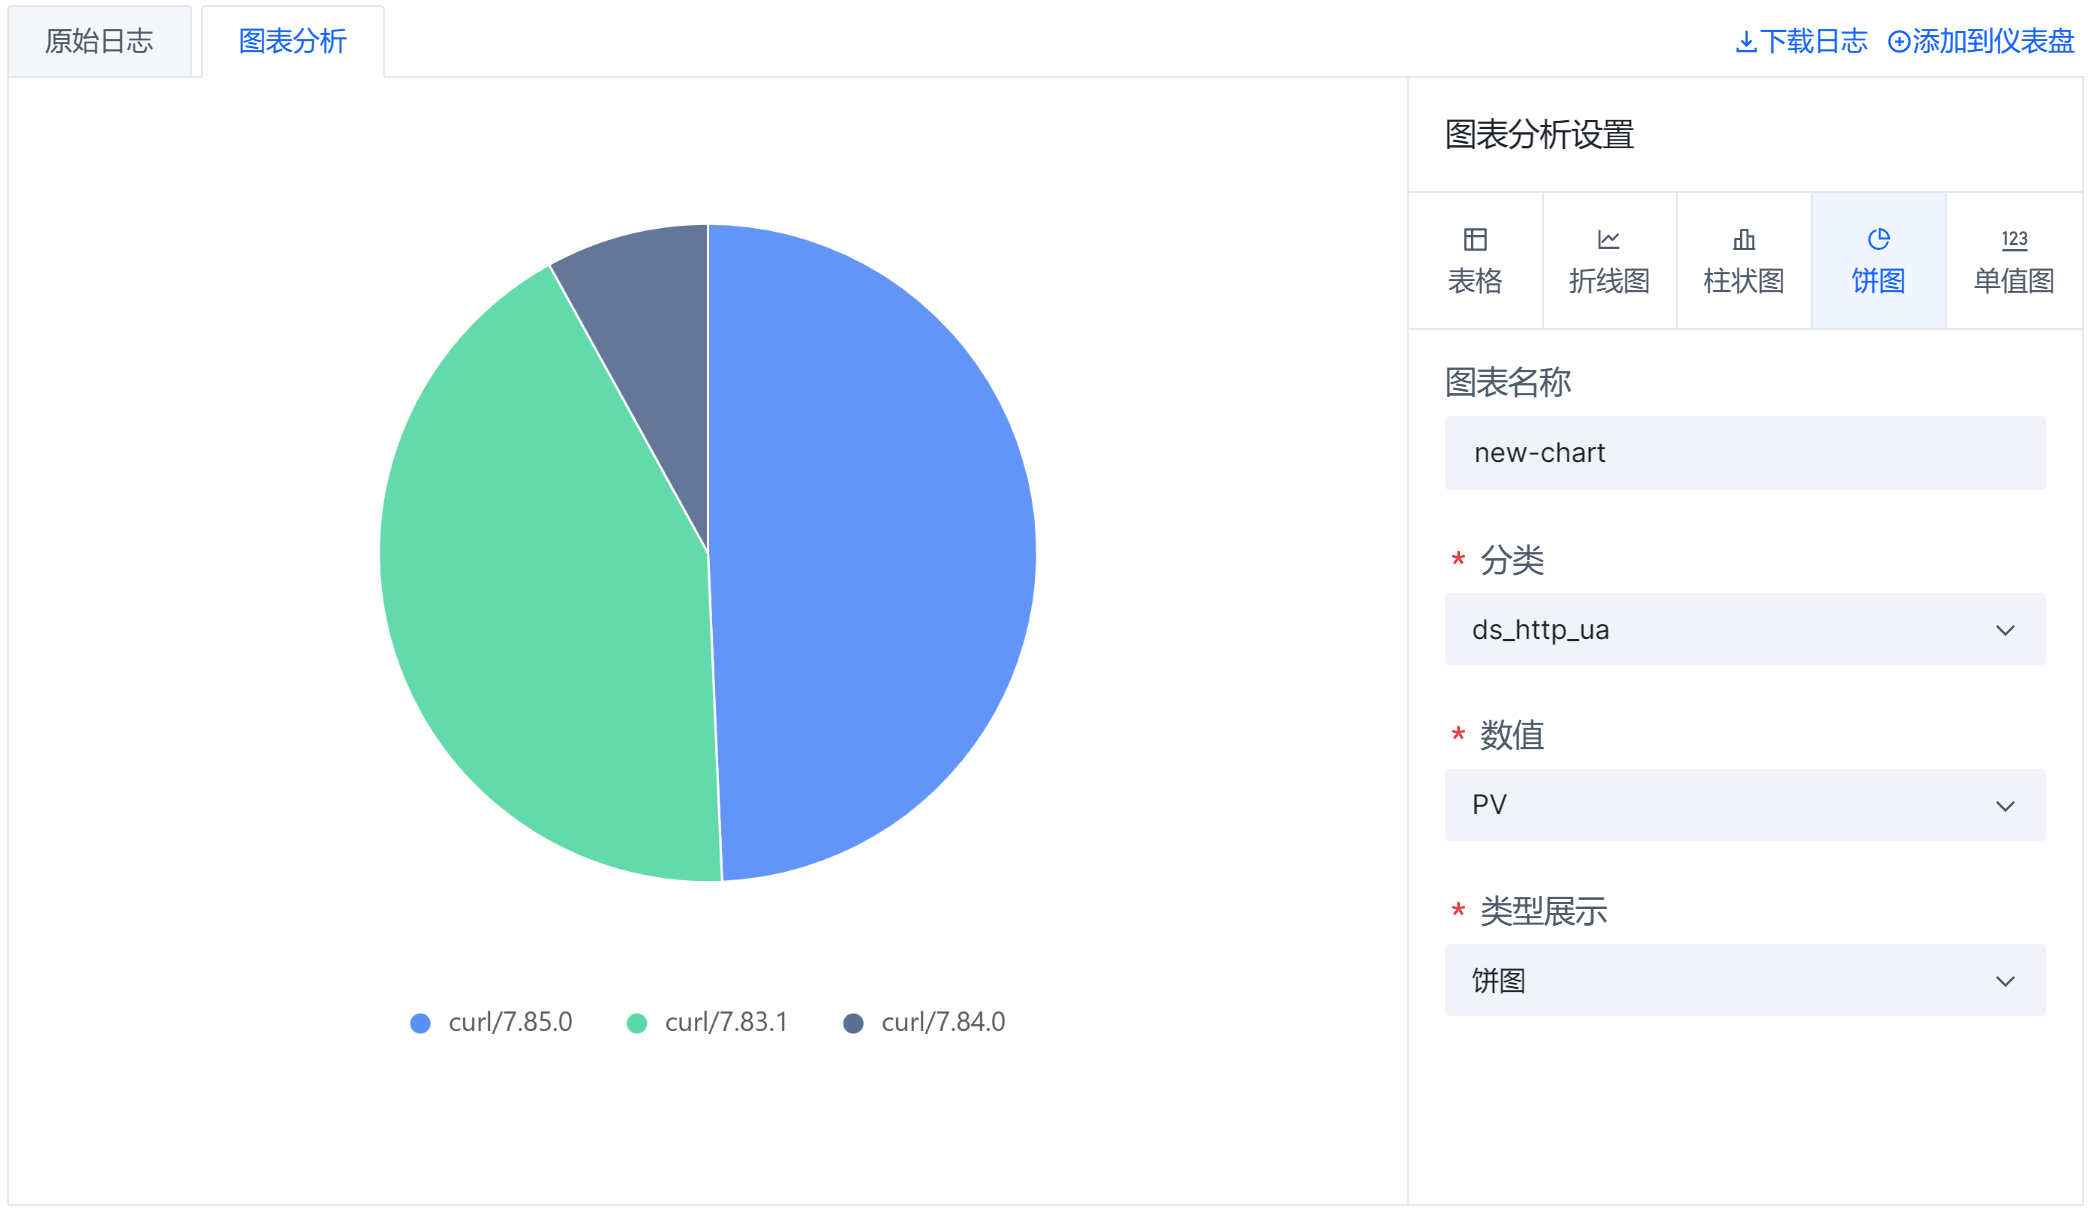
统计 CDN 响应的大小
需求:
- 以 5 分钟为时间粒度,统计每个时间段内的以下数据:
- 请求错误所对应的 CDN 响应大小的平均值。
检索语法:
ds_http_status:>=400 |select __time__ - __time__ % 300000 as time,AVG(ds_http_resp_size) as SIZE group by time
检索结果展示:时序图
检索结果截图: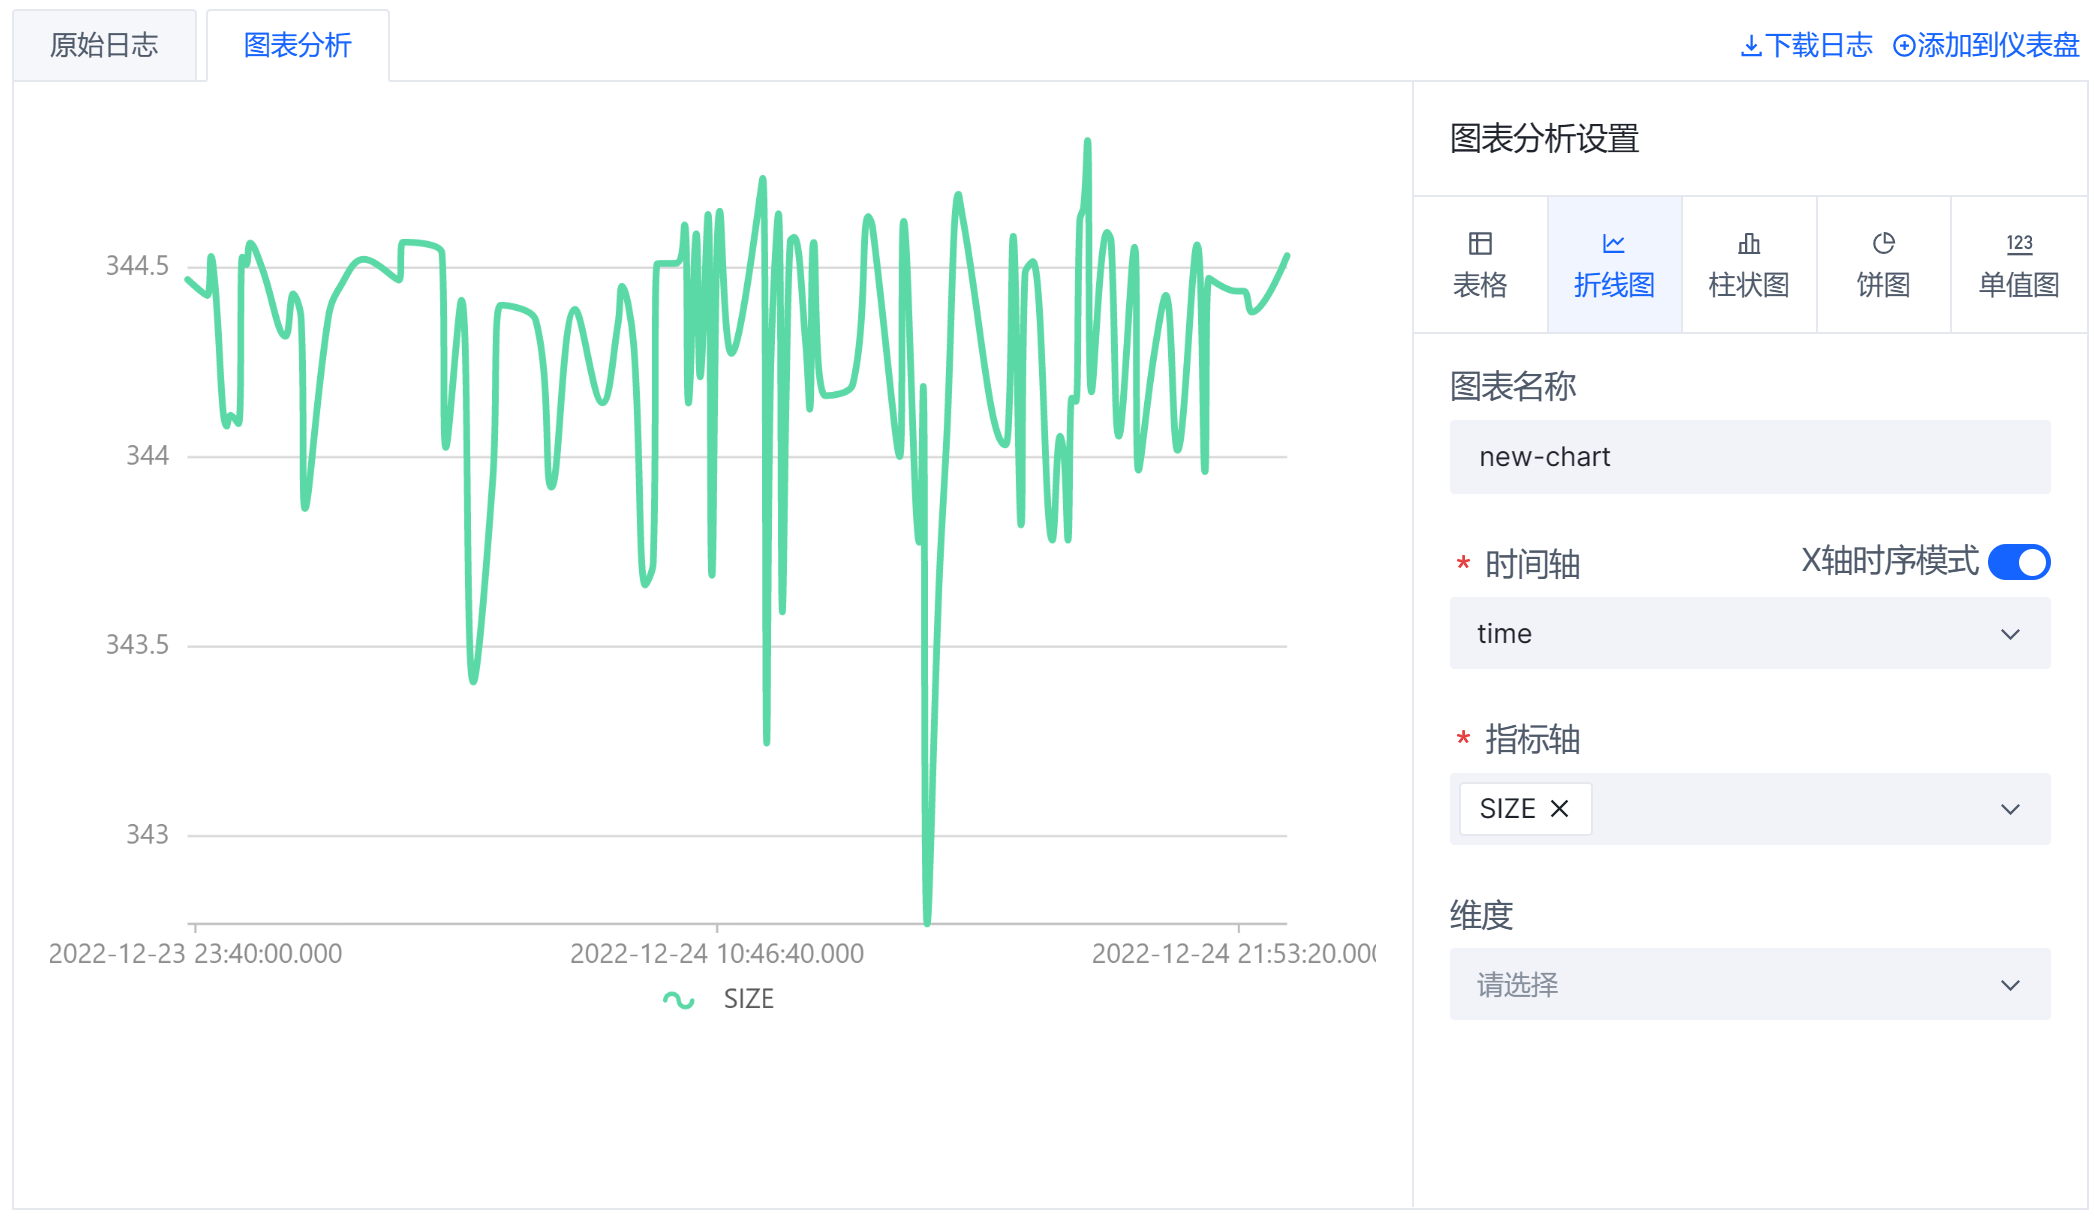
统计请求错误数量的比例
需求:
- 以 5 分钟为时间粒度,统计每个时间段内请求错误数量的比例。
检索语法:
* | select __time__ - __time__ % 300000 as time , sum(case when ds_http_status BETWEEN 400 AND 599 then 1 else 0 end) / count(*) as percent group by time
检索结果展示:时序图
检索结果截图: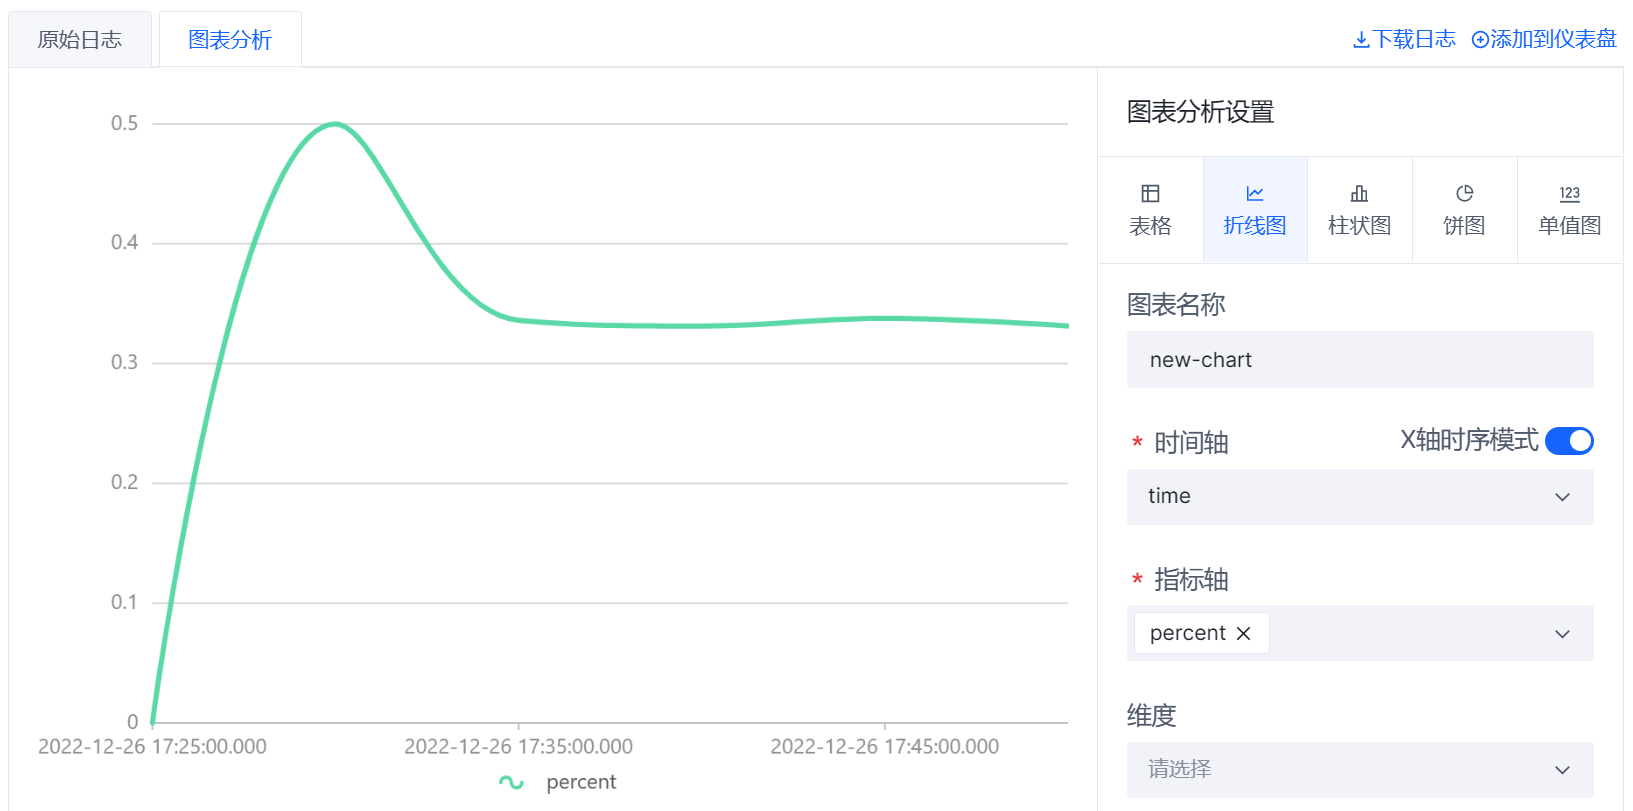
获取请求错误码的数量
需求:
- 基于错误码统计请求错误的数量。
检索语法:
ds_http_status:>=400 | select ds_http_status,count(*) As errors group by ds_http_status
检索结果展示:饼图
检索结果截图: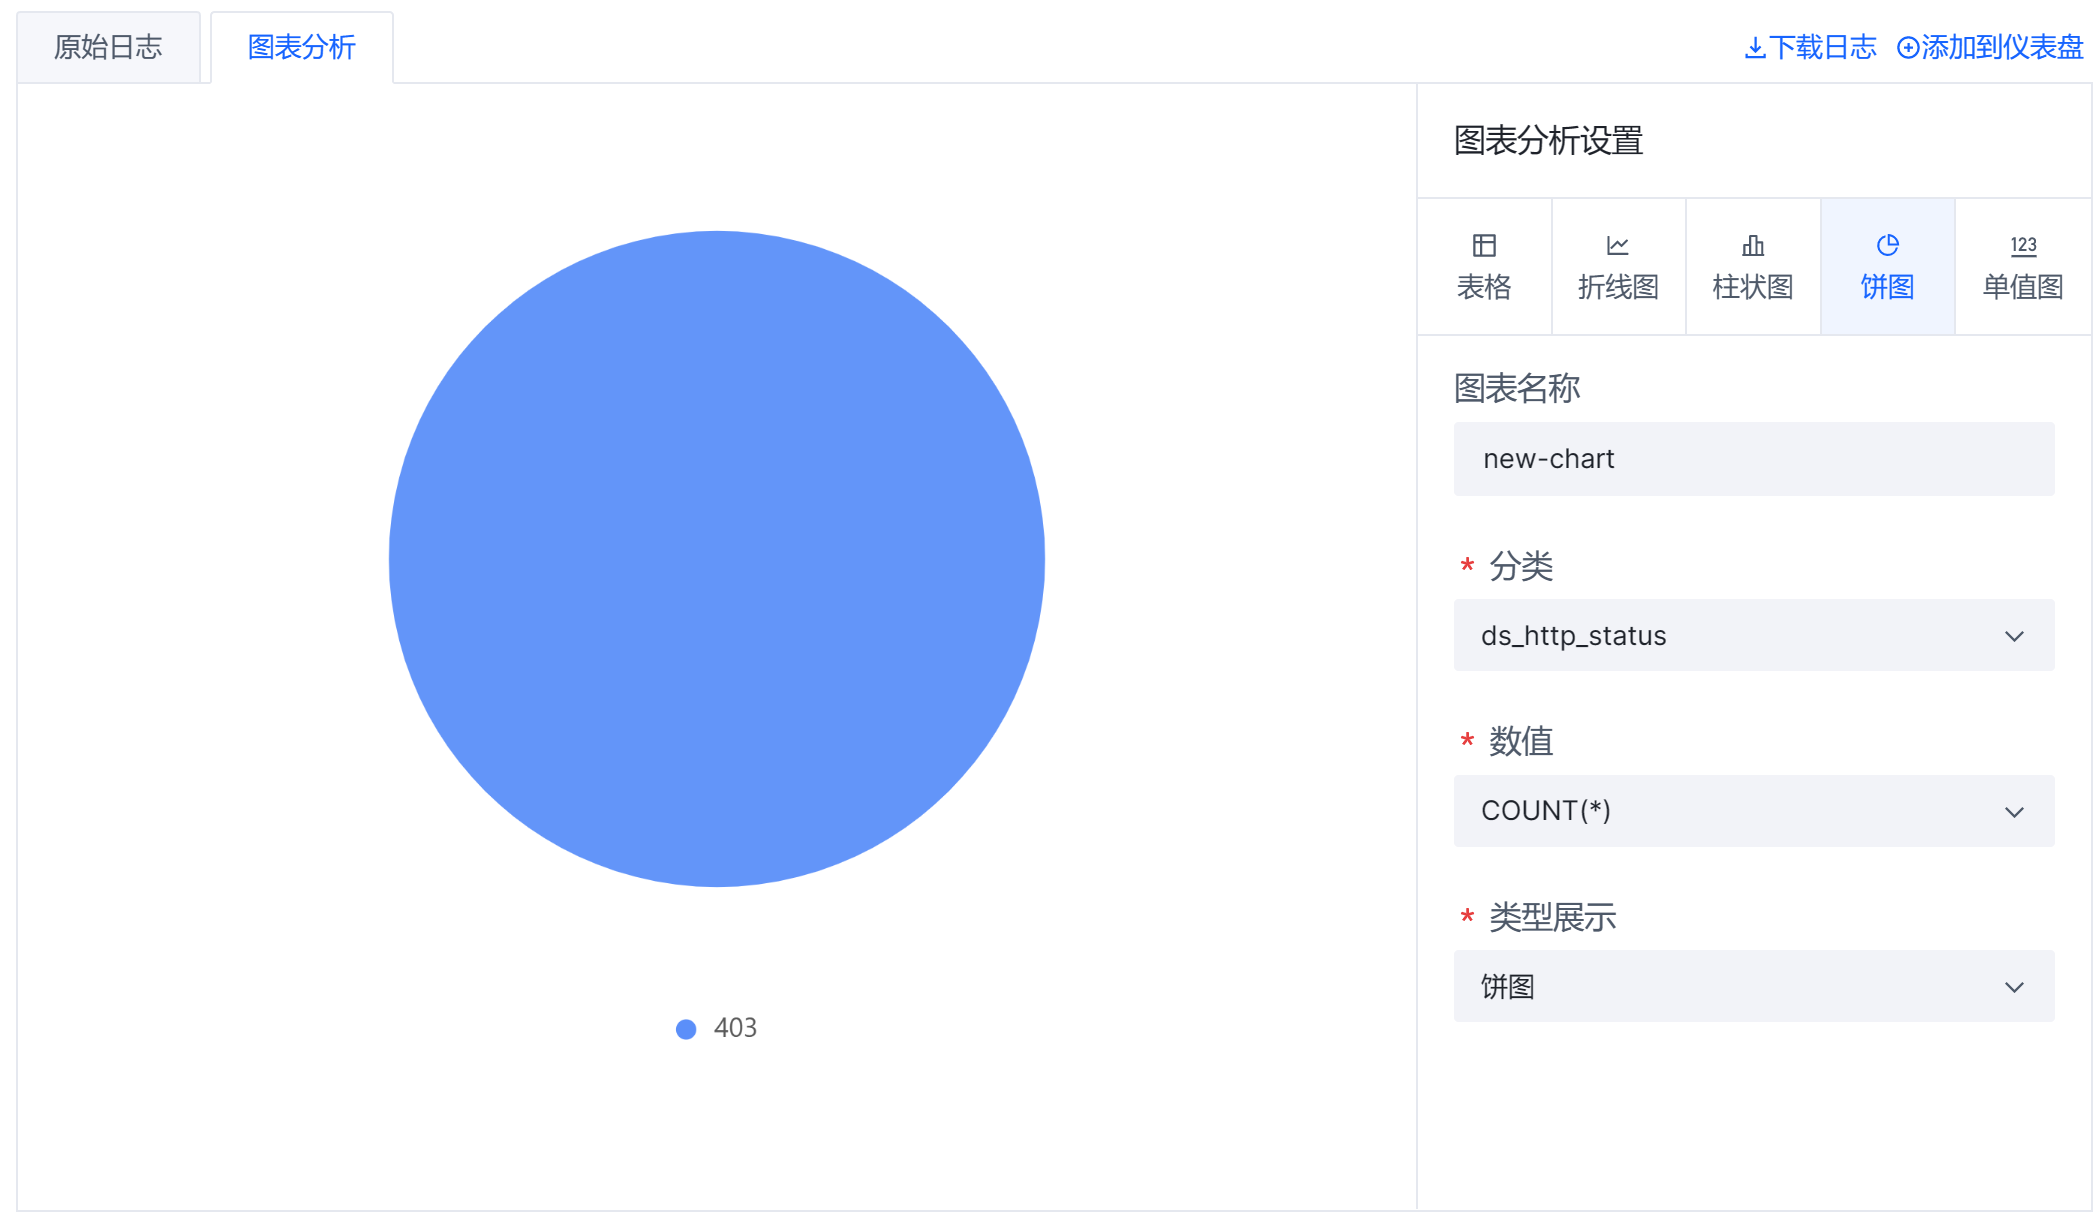
监测 CDN 服务指标
统计响应总字节数排行以及平均响应时长
需求:
- 基于 URL 统计 CDN 响应的总字节数以及平均响应时长,然后根据响应的总字节数对结果进行降序排序。
响应时长的单位是秒。
检索语法:
* | select domain,ds_http_uri,ds_http_resp_content_type,sum(ds_http_resp_size) AS total_size,avg(ds_http_resp_size) AS resource_size,avg(ds_req_time) as avg_resp_time, count(*) as PV group by domain,ds_http_uri,ds_http_resp_content_type order by total_size DESC
检索结果展示:表格
检索结果截图:
统计响应慢的请求数占比
需求:
- 基于客户端 IP 统计以下数据。数据以降序排序。
- 响应时长超过 10 秒的请求数占比。
检索语法:
* | select client_ip, pv/c as rate from (select client_ip, sum(case when ds_req_time > 10 then 1 else 0 end) as pv, count(*) * 1.0000 as c group by client_ip ) order by rate DESC
检索结果展示:表格
检索结果截图: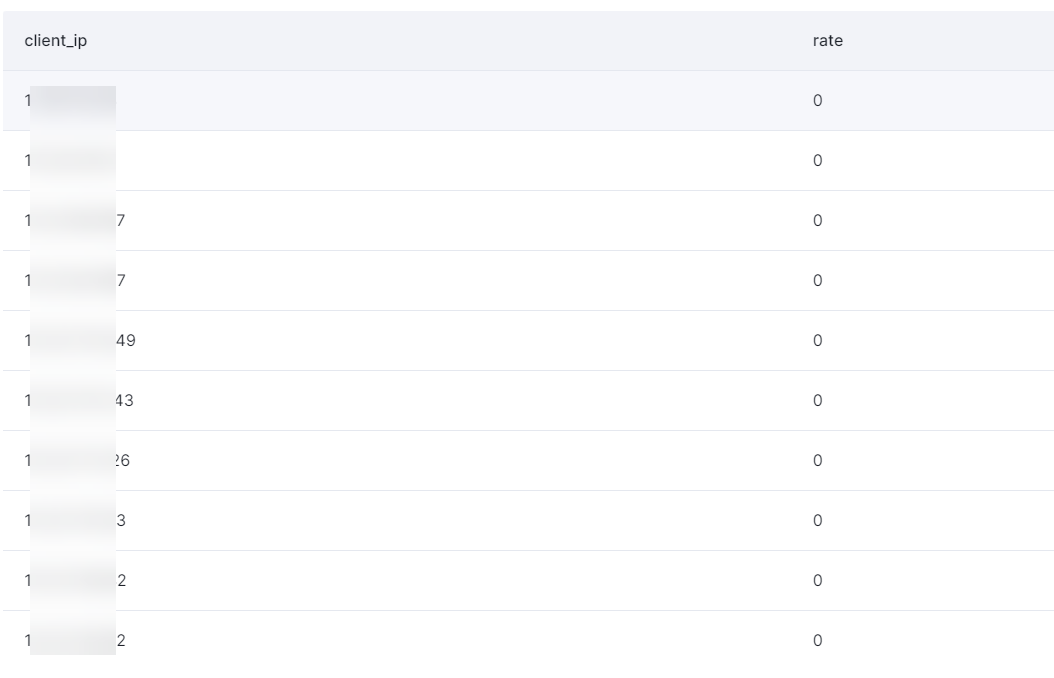
统计 CDN 向用户传输数据的速度
速度单位是 Mbps。
需求:
- 基于 5 分钟的时间粒度,统计每个时间段内数据传输速度。
数据传输速度的单位是 Mbps。
检索语法:
* |select __time__ - __time__ % 300000 as time,avg(ds_http_resp_size)*8/1000/1000/avg(ds_req_time) as download_speed group by time
检索结果展示:时序图
检索结果截图: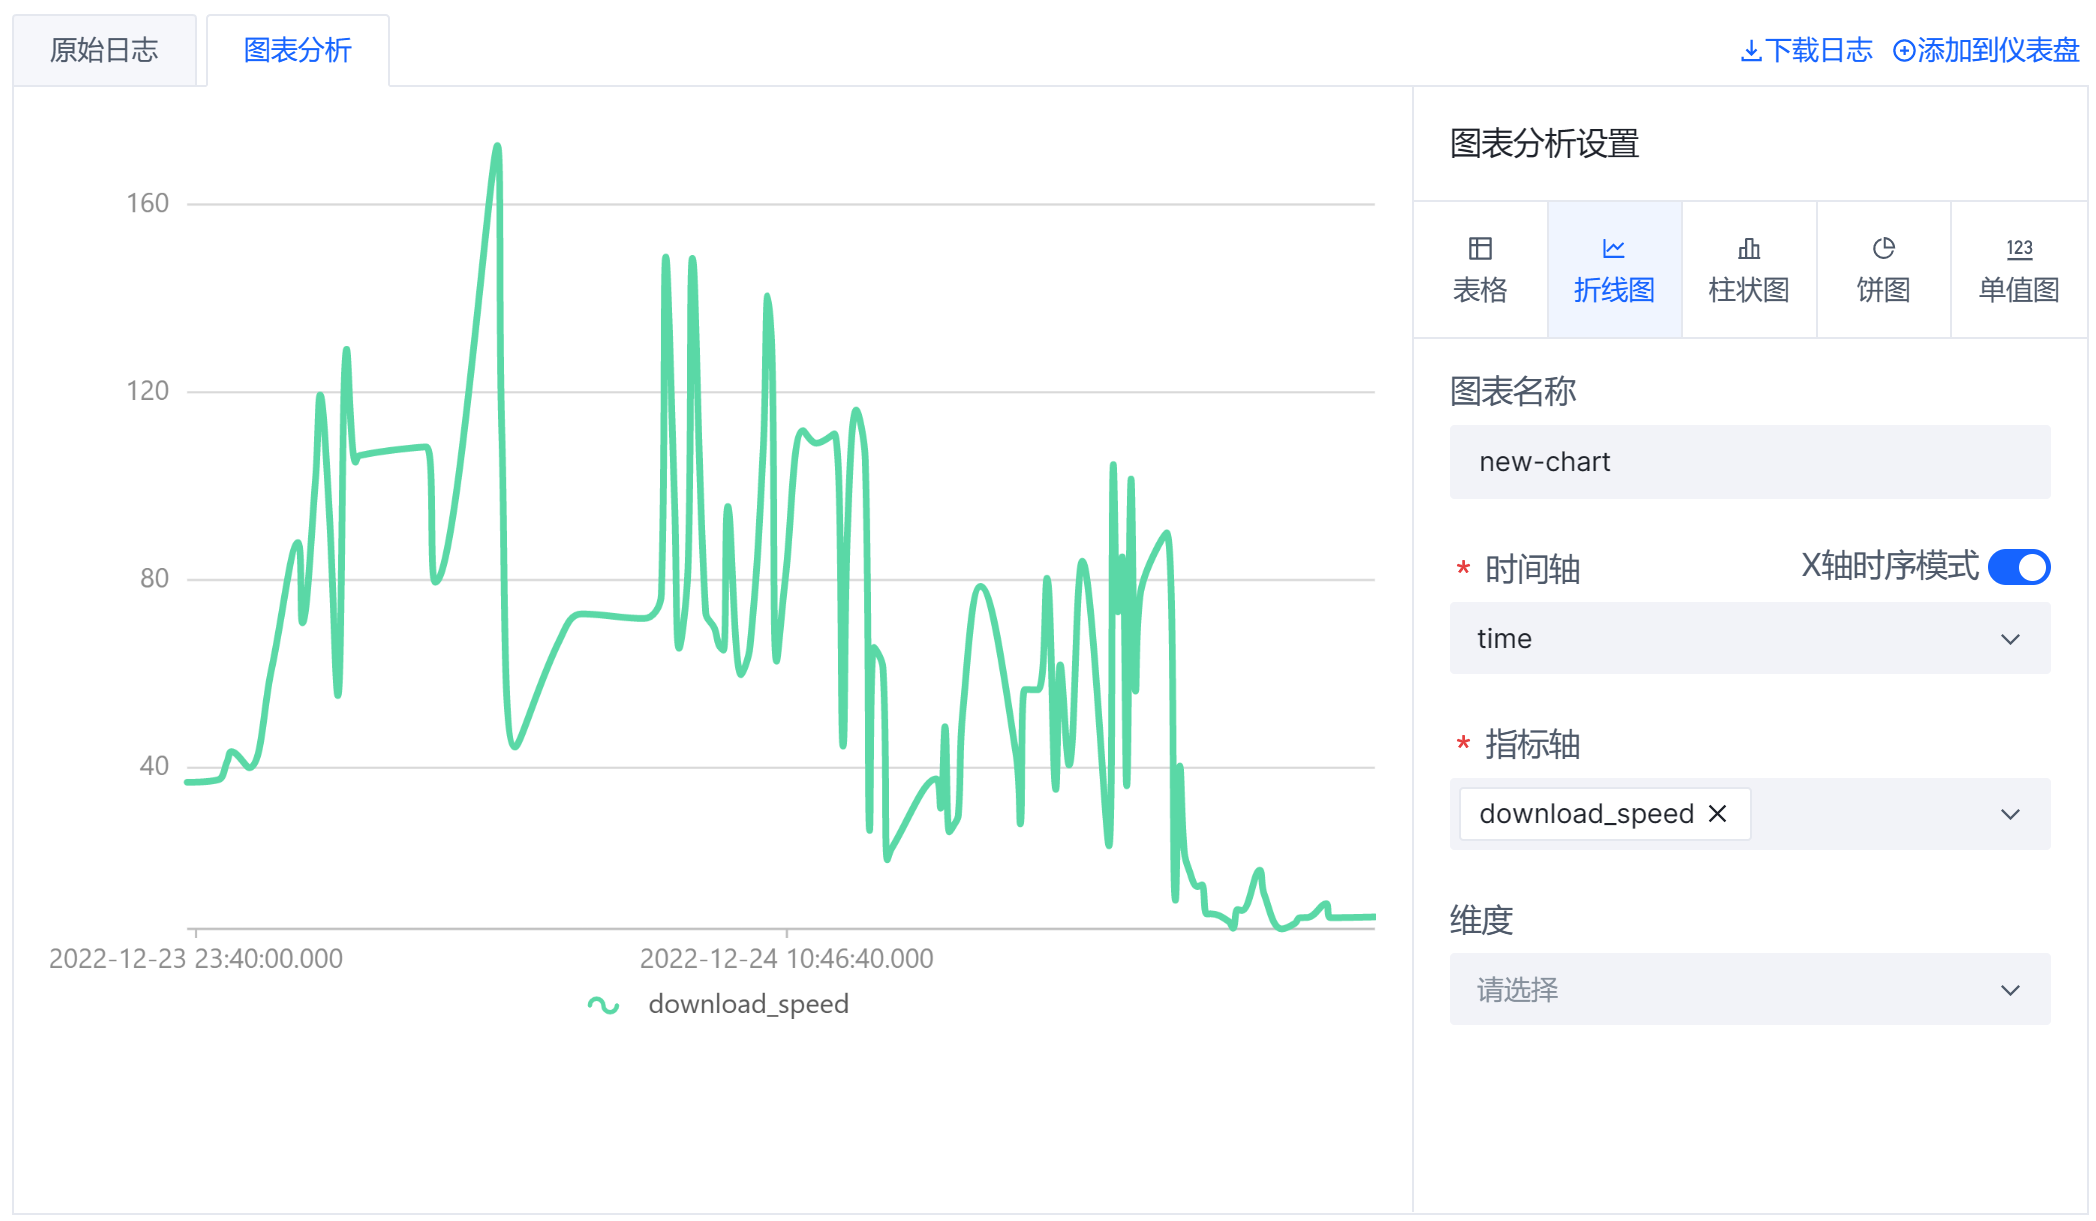
统计 CDN 的响应时长
需求:
- 基于 5 分钟的时间粒度,统计每个时间段内平均响应时长。
响应时长的单位是秒。
检索语法如下:
* |select __time__ - __time__ % 300000 as time,AVG(ds_req_time) as req_time group by time
检索结果展示:时序图
检索结果截图: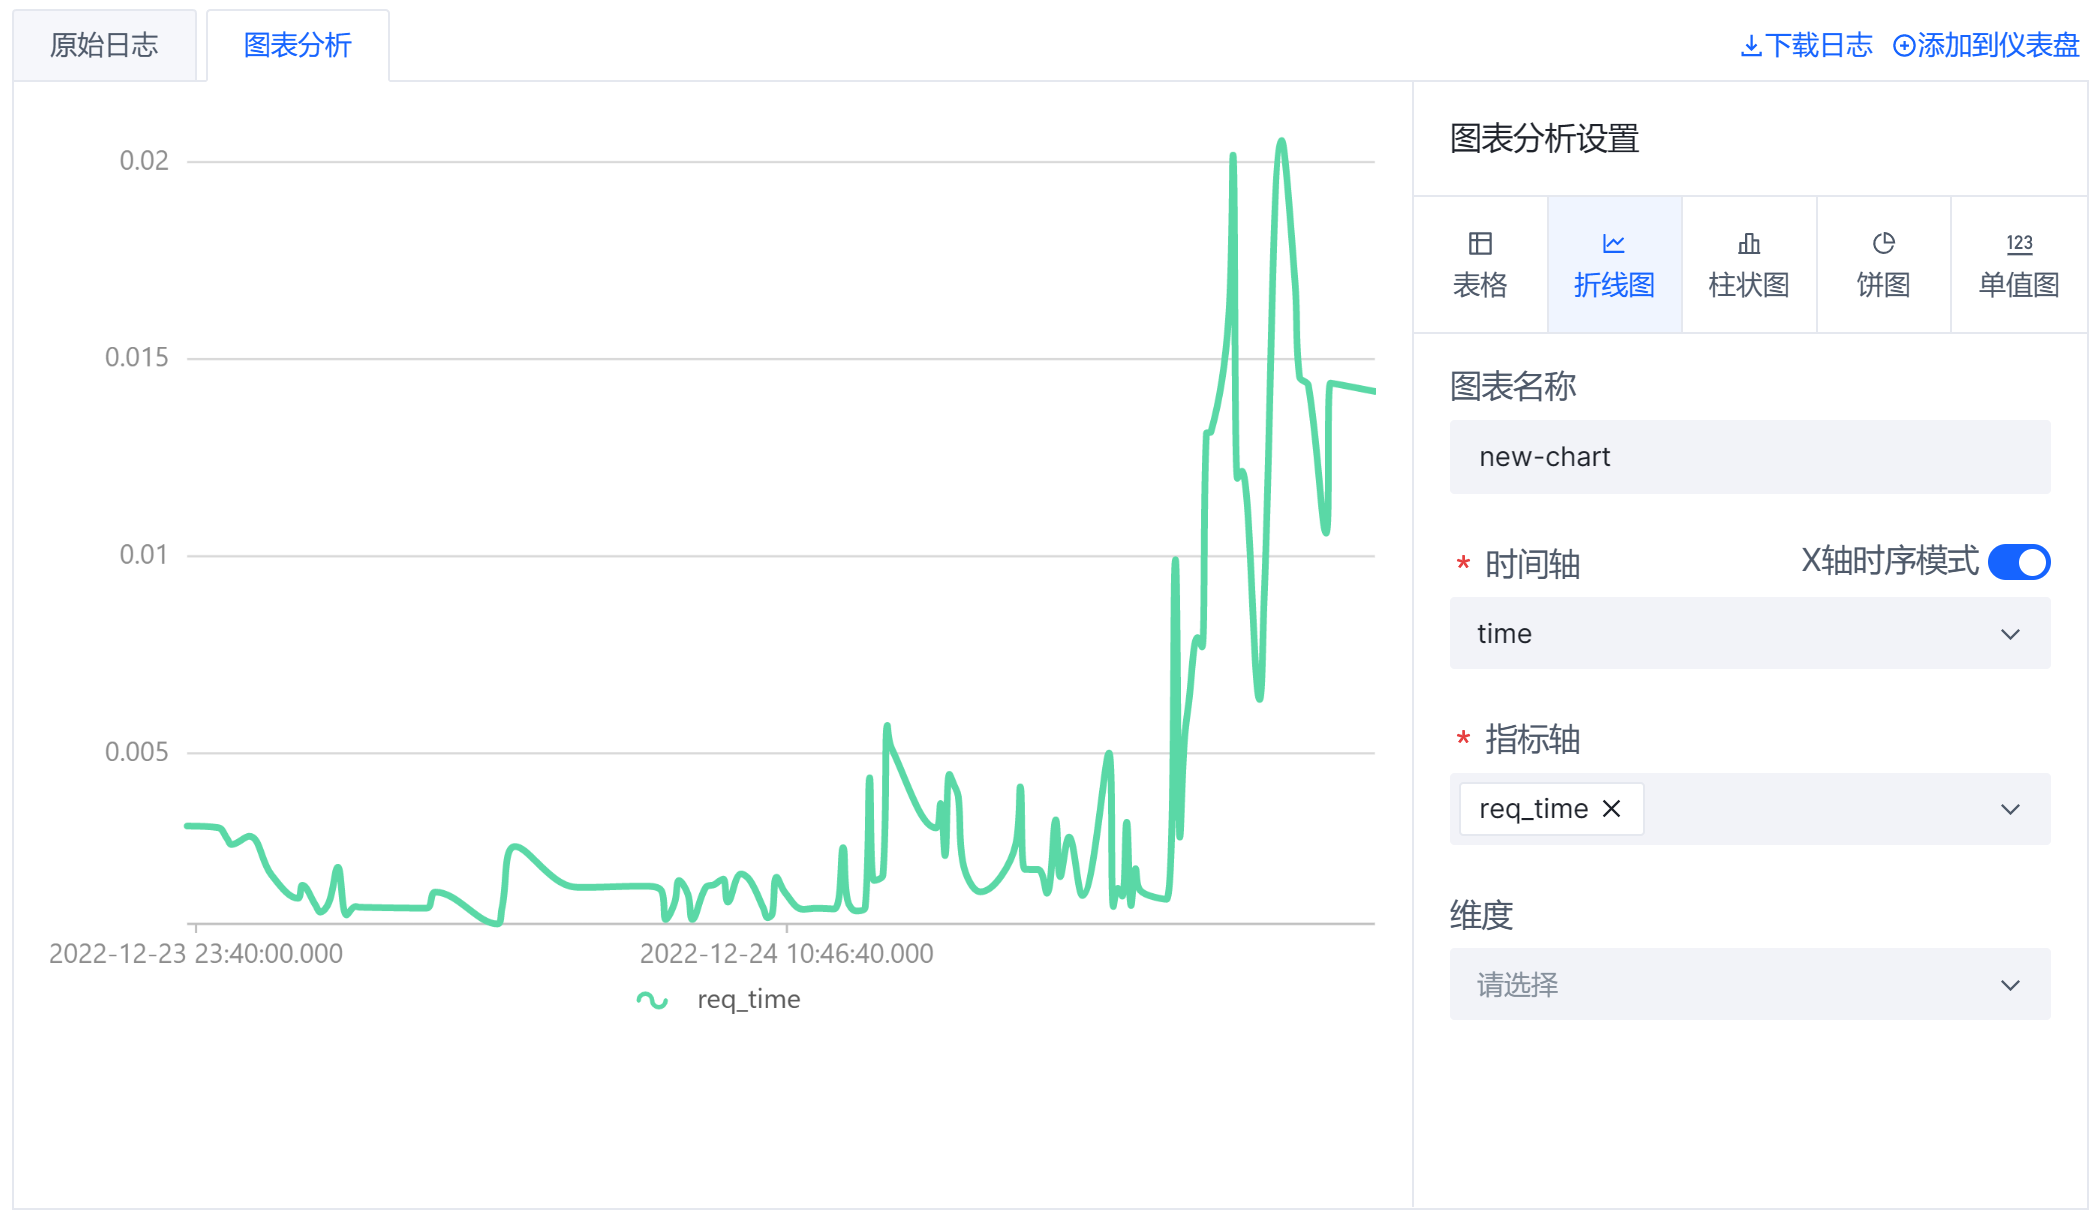
统计命中率
需求:
- 基于 5 分钟的时间粒度,统计每个时间段内的缓存命中率以及流量命中率。
检索语法:
* | select __time__ - __time__ % 300000 as Time , sum(case when ds_http_bd_status_hit='hit' then 1 else 0 end) / count(*) as count_percent , sum(case when ds_http_bd_status_hit='hit' then ds_http_resp_size else 0.0 end) / sum(ds_http_resp_size) as size_percent group by Time
检索结果展示:时序图
检索结果截图: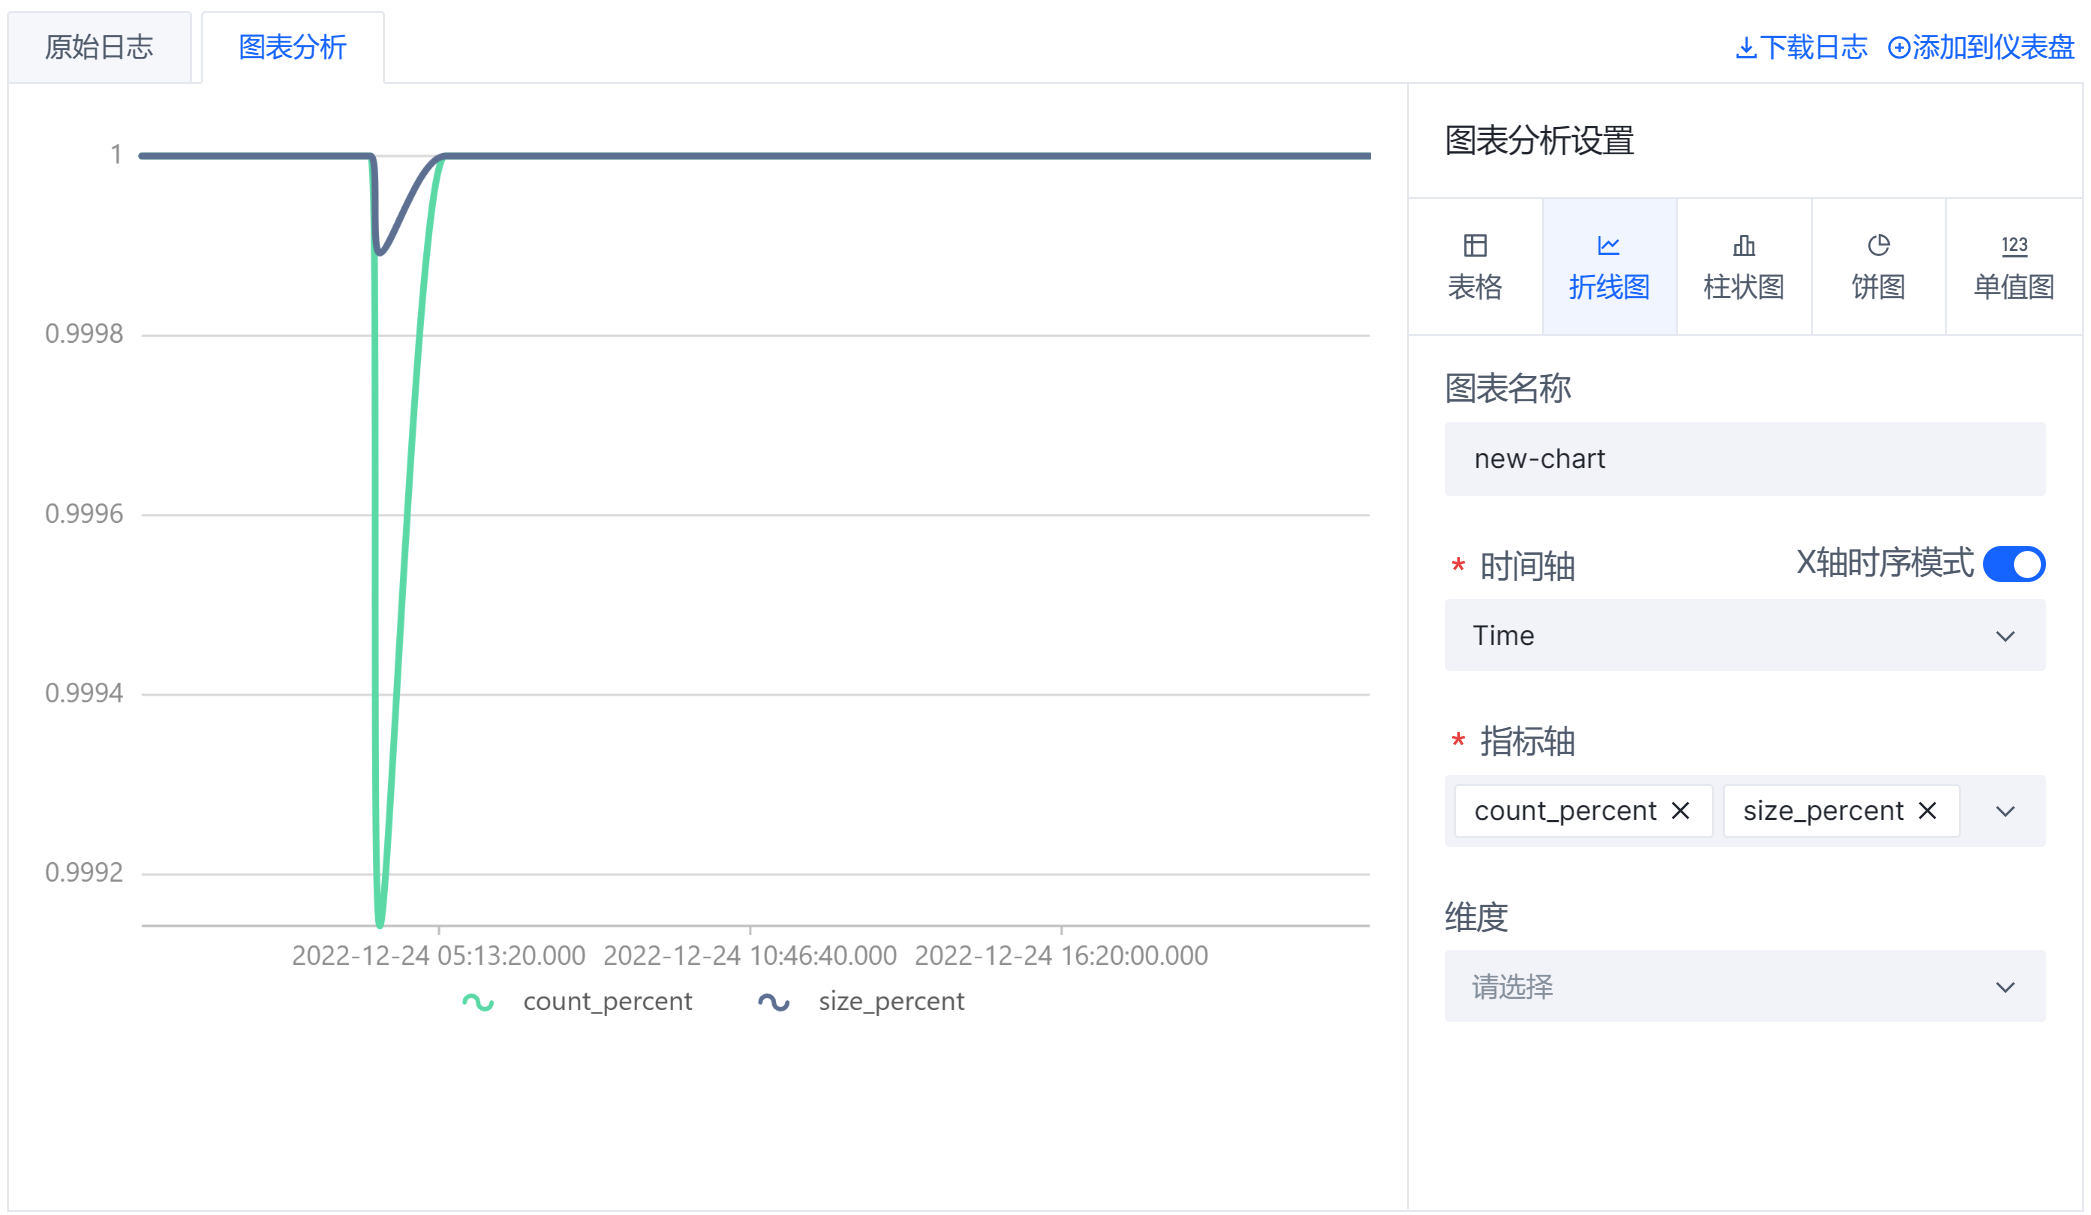
统计 CDN 服务的可用性
需求:
- 统计由于 CDN 内部错误而导致请求失败的次数。
检索语法:
* | select sum(case when ds_http_status<500 then 1 else 0 end ) / count(*) as count
检索结果展示:单值图
检索结果截图:
统计 CDN 的缓存未命中率
需求:
- 统计 CDN 的缓存未命中率。
检索语法:
* | select sum(case when ds_http_bd_status_hit='miss' then 1 else 0 end) / count(*) as miss_rate
检索结果展示:单值图
检索结果截图: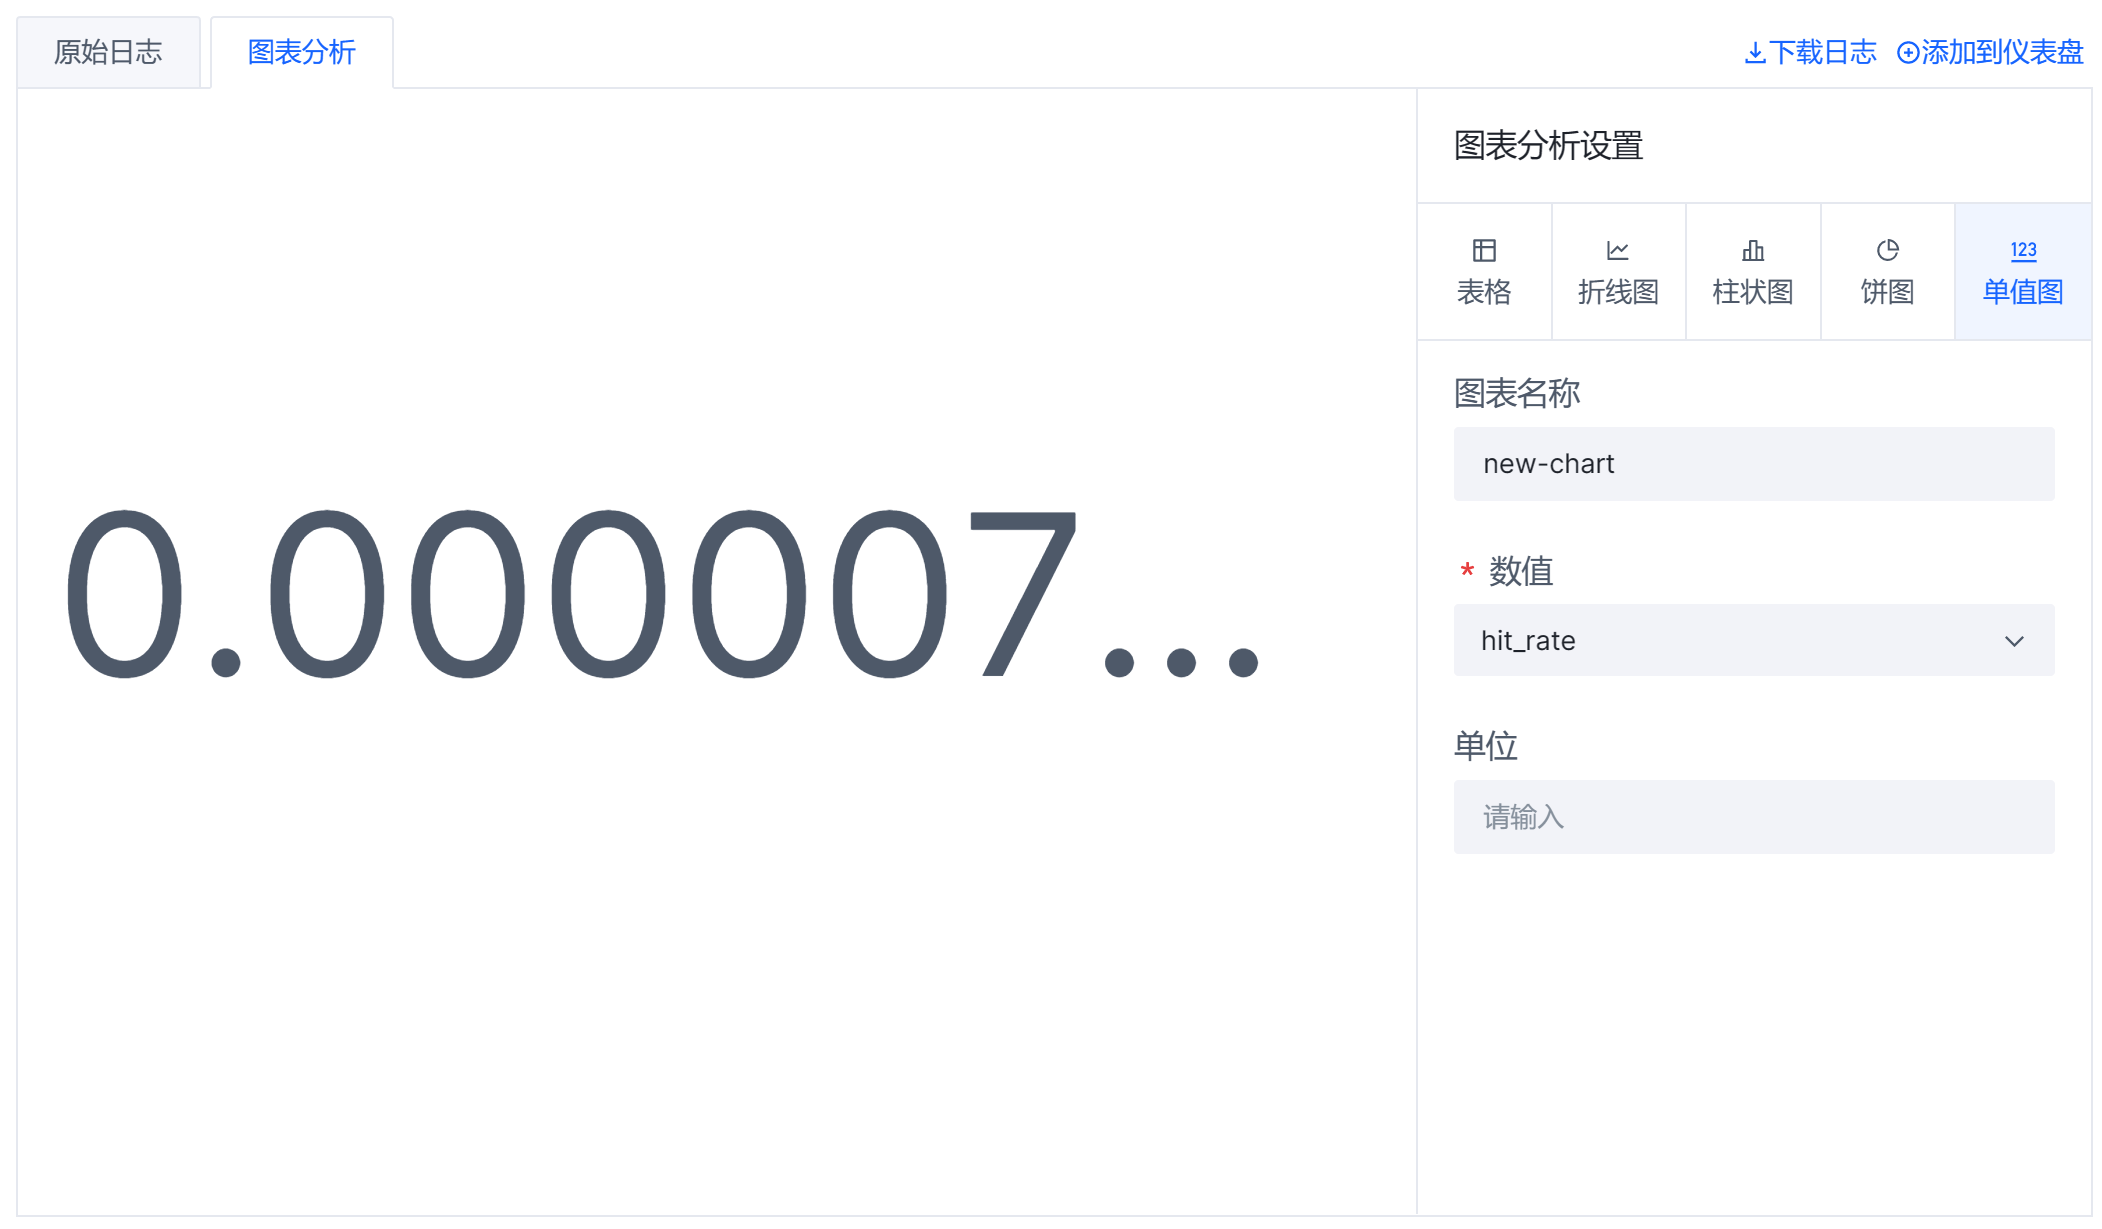
获取热门访问
统计 TOP Referer(基于用户请求数)
需求:
- 在所有的客户端请求中,统计 TOP 10 的 Referer。
检索语法:
*| select ds_http_referer,count(*) as PV group by ds_http_referer order by PV desc limit 10
检索结果展示:表格
检索结果截图:
统计 TOP Referer(基于回源请求数)
需求:
- 在触发回源的用户请求中,统计 TOP 10 的 Referer。
检索语法:
ds_http_bd_status_hit:MISS |select ds_http_referer,count(*) as PV group by ds_http_referer order by PV desc limit 10
检索结果展示:表格
检索结果截图:
统计 TOP 客户端 IP(基于用户请求数)
需求:
- 在所有的用户请求中,统计发送请求数量最多的 10 个客户端 IP 地址。
检索语法:
*|select client_ip,count(*) as PV group by client_ip order by PV desc limit 10
检索结果展示:表格
检索结果截图: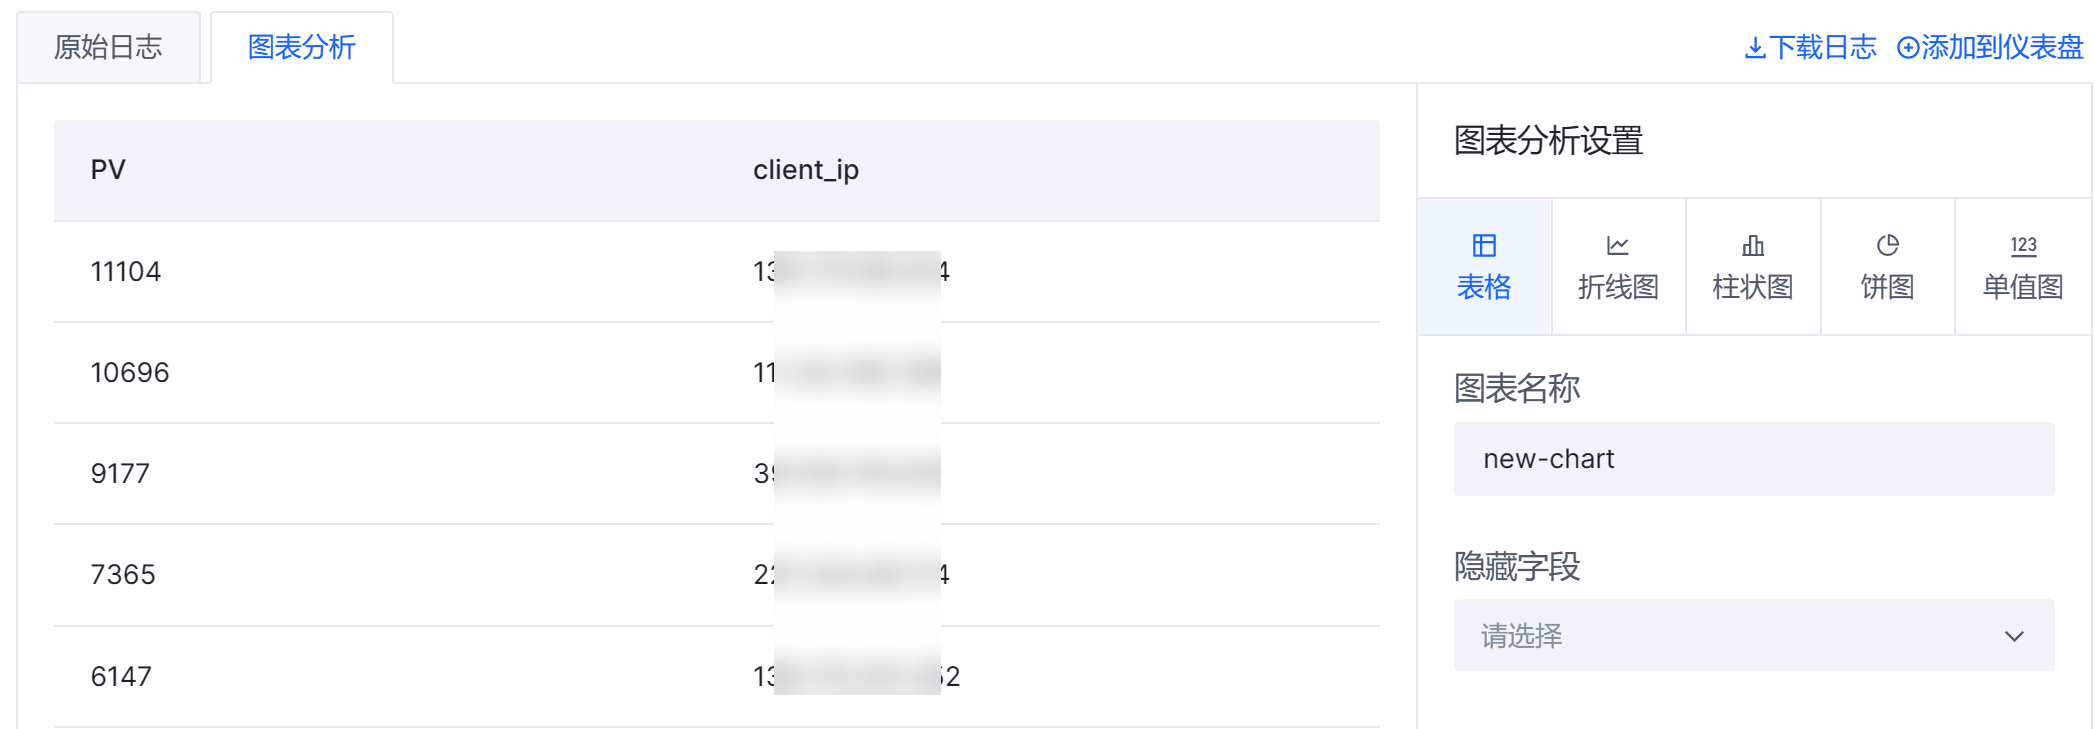
统计 TOP 客户端 IP(基于回源请求数)
需求:
- 在触发回源的用户请求中,统计发送请求数量最多的 10 个客户端 IP 地址。
检索语法:
ds_http_bd_status_hit:MISS |select client_ip,count(*) as PV group by client_ip order by PV desc limit 10
检索结果展示:表格
检索结果截图: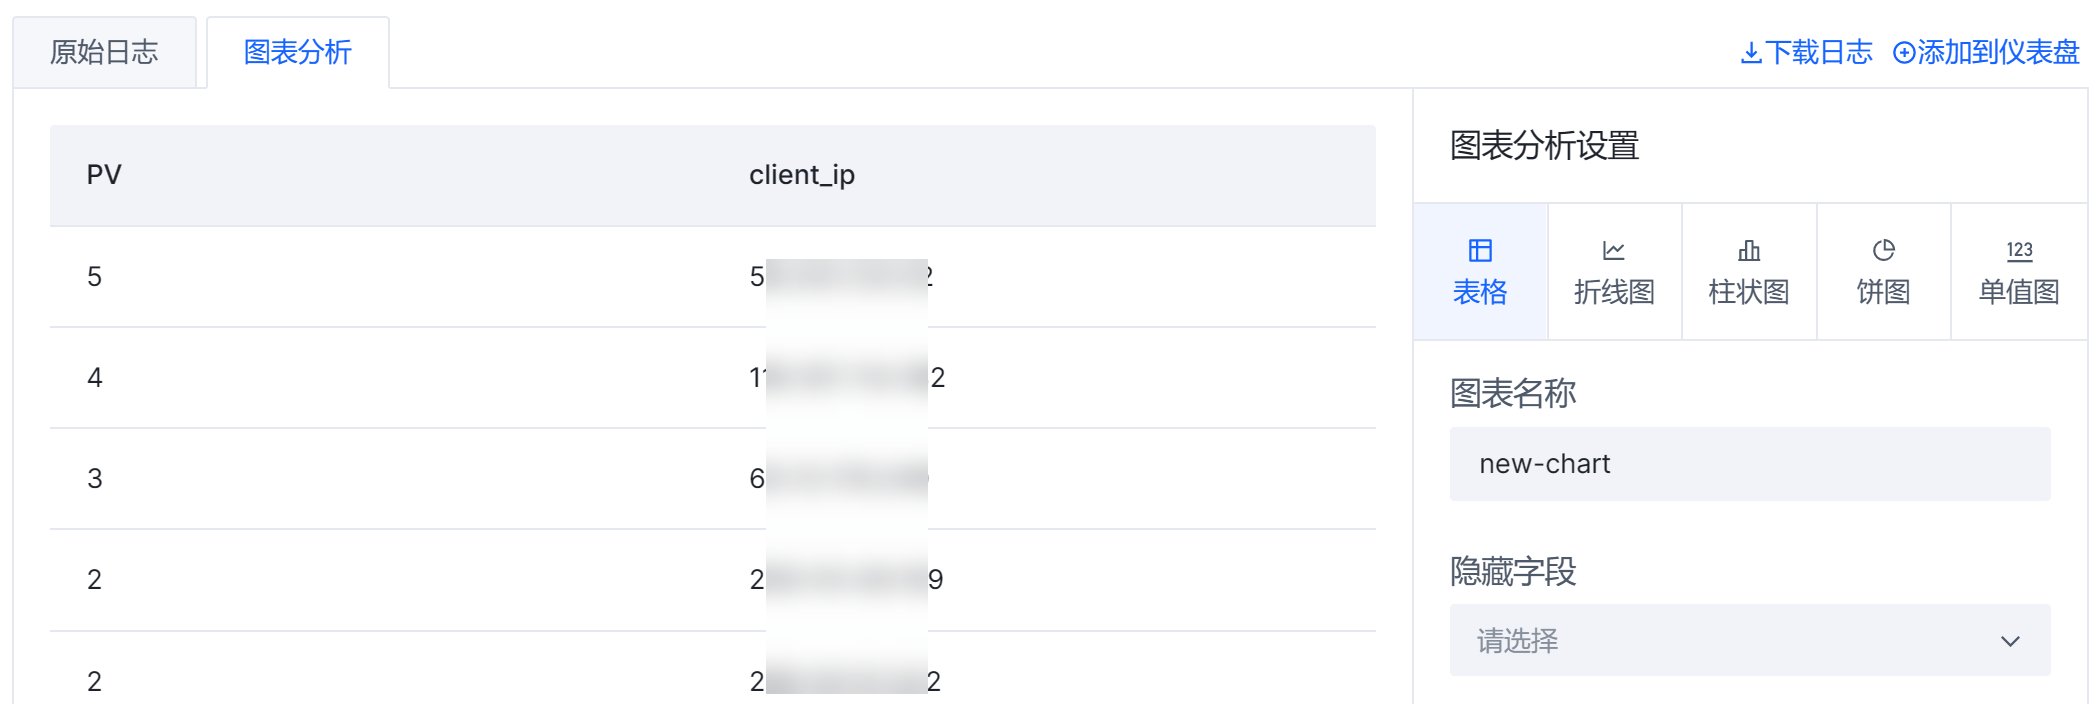
统计 TOP URL(基于用户请求数)
需求:
- 统计请求数量最多的 10 个 URL。
检索语法:
*|select ds_http_uri,count(*) as PV group by ds_http_uri order by PV desc limit 10
检索结果展示:表格
检索结果截图: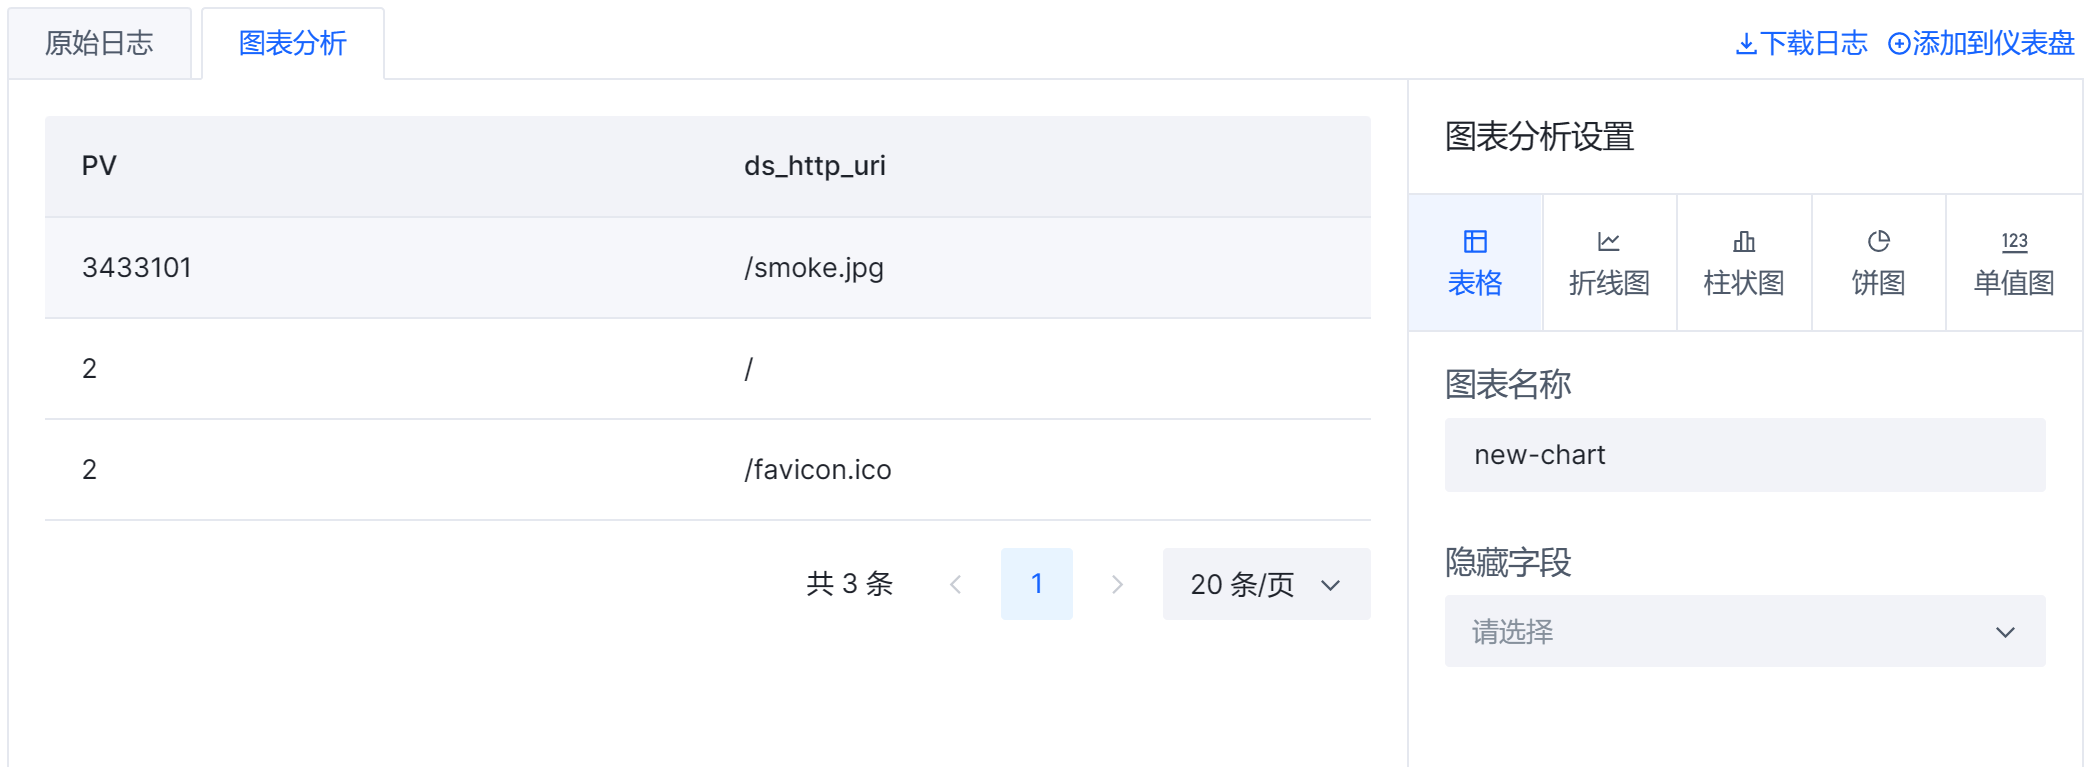
统计 TOP URL(基于回源请求数)
需求:
- 在触发回源的用户请求中,统计请求数量最多的 10 个 URL。
检索语法:
ds_http_bd_status_hit:MISS |select ds_http_uri,count(*) as PV group by ds_http_uri order by PV desc limit 10
检索结果展示:表格
检索结果截图: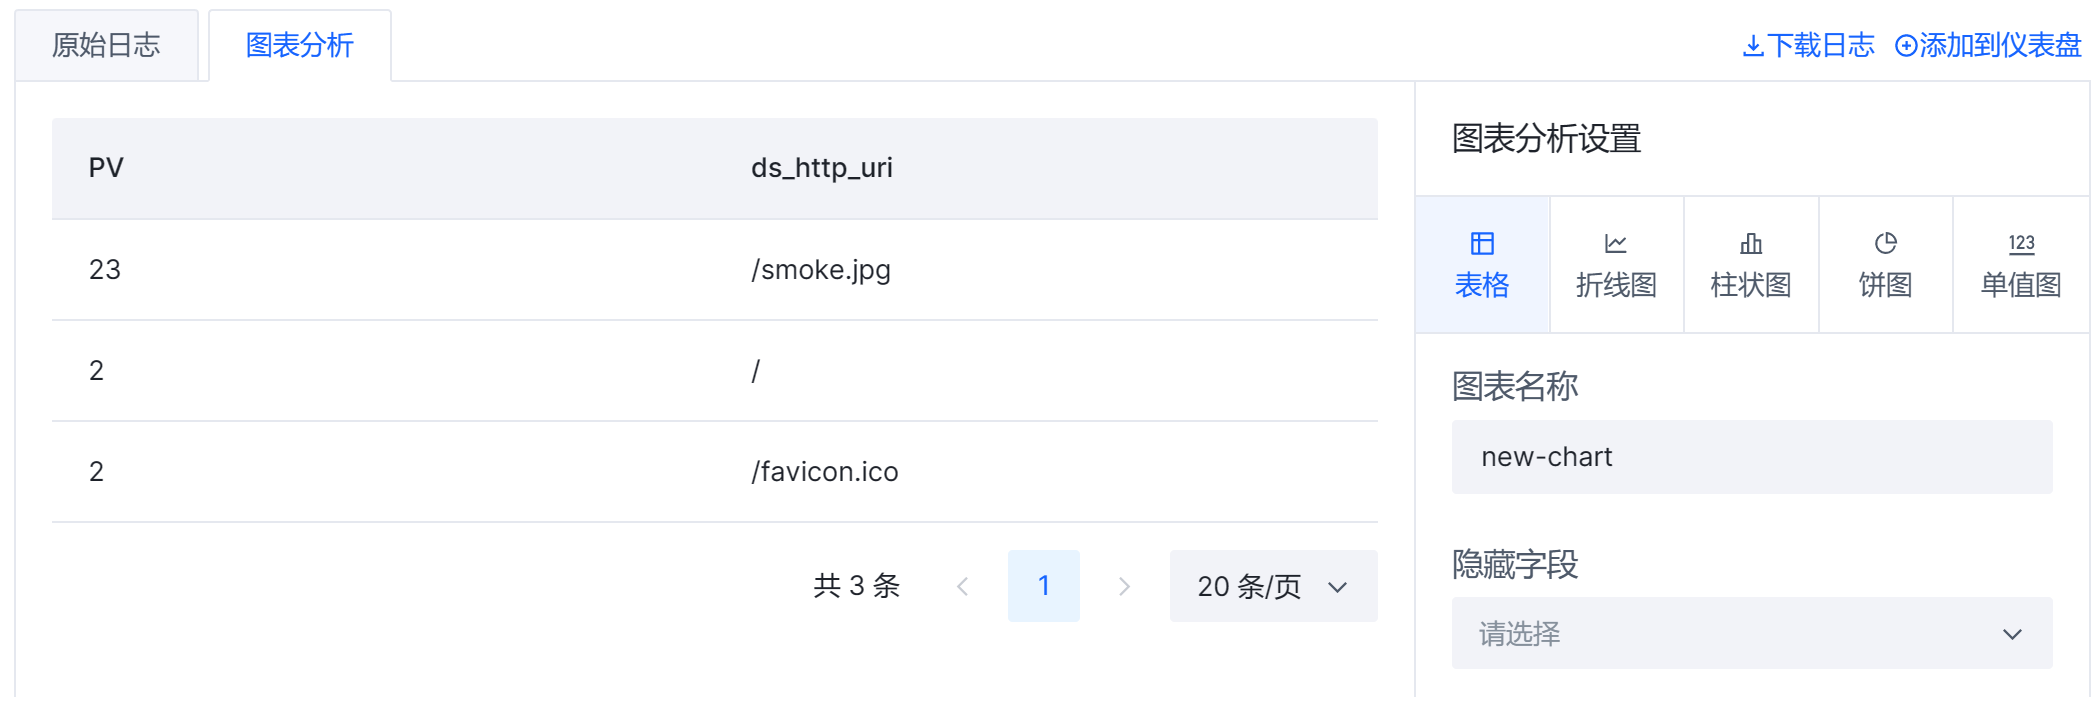
统计 TOP UA(基于用户请求数)
需求:
- 统计 TOP 10 的 User-Agent。
检索语法:
*|select ds_http_ua,count(*) as PV group by ds_http_ua order by PV desc limit 10
检索结果展示:表格
检索结果截图: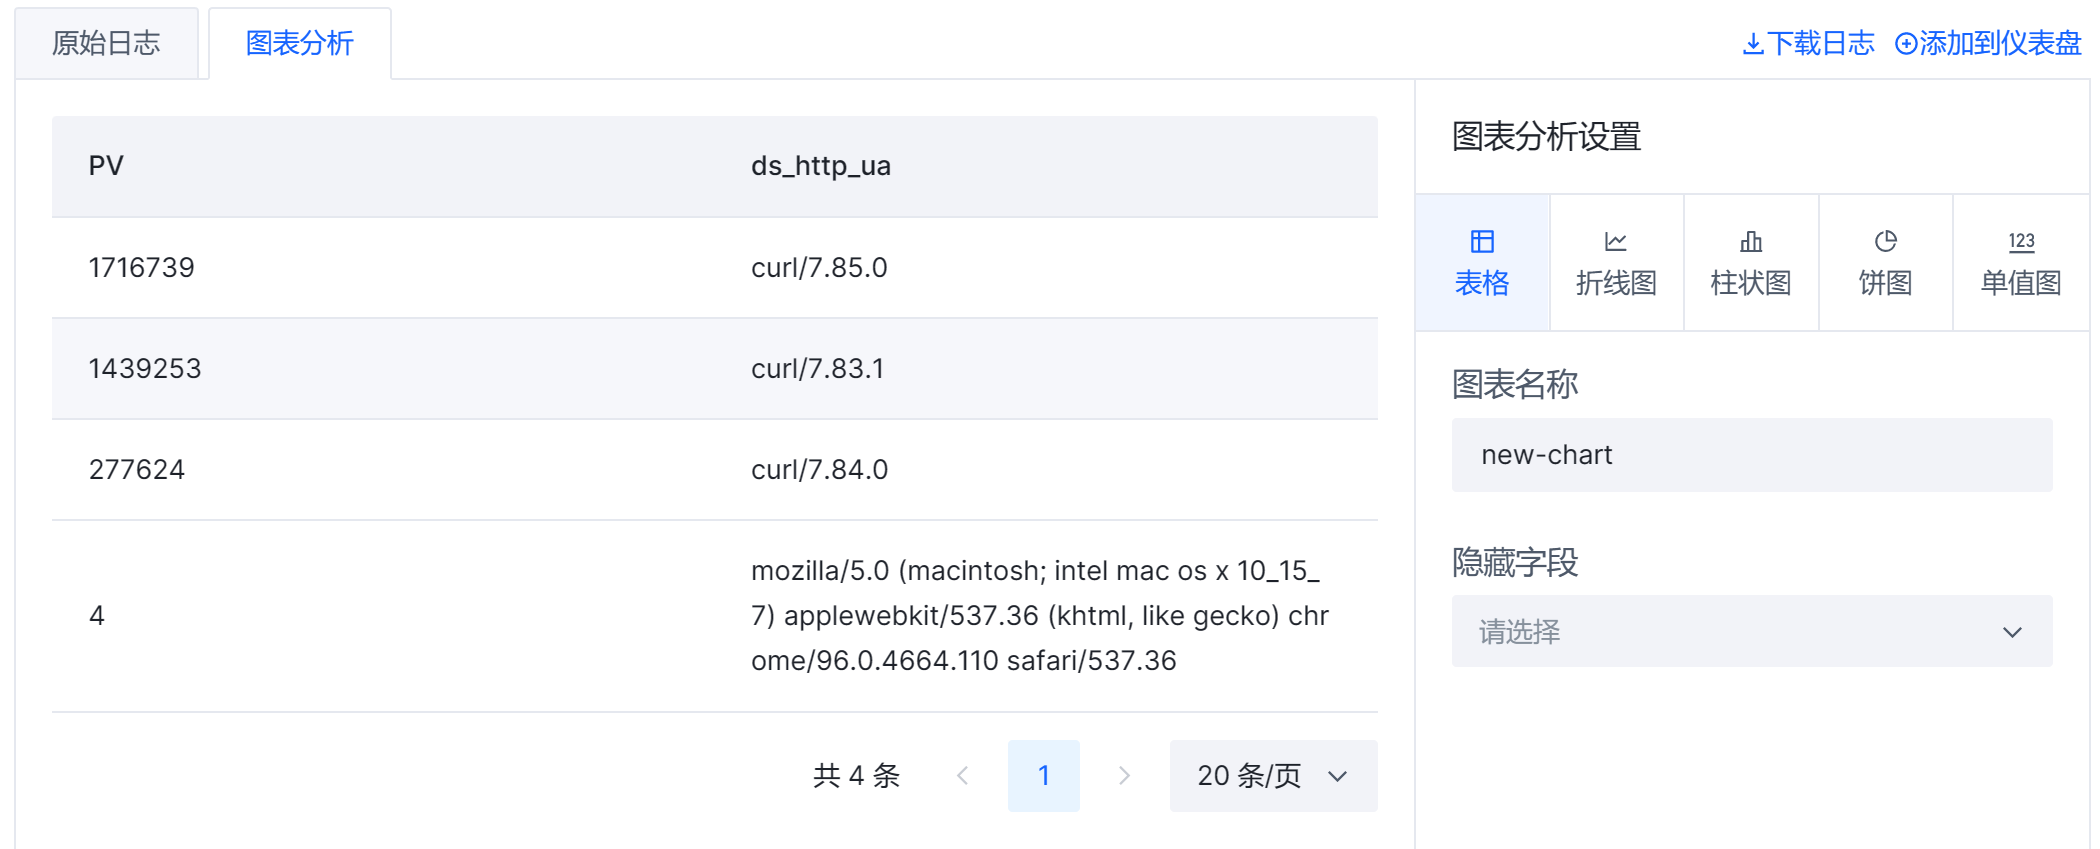
统计 TOP UA(基于回源请求数)
需求:
- 在触发回源的用户请求中,统计 TOP 10 的 User-Agent。
检索语法:
ds_http_bd_status_hit:MISS |select ds_http_ua,count(*) as PV group by ds_http_ua order by PV desc limit 10
检索结果展示:表格
检索结果截图: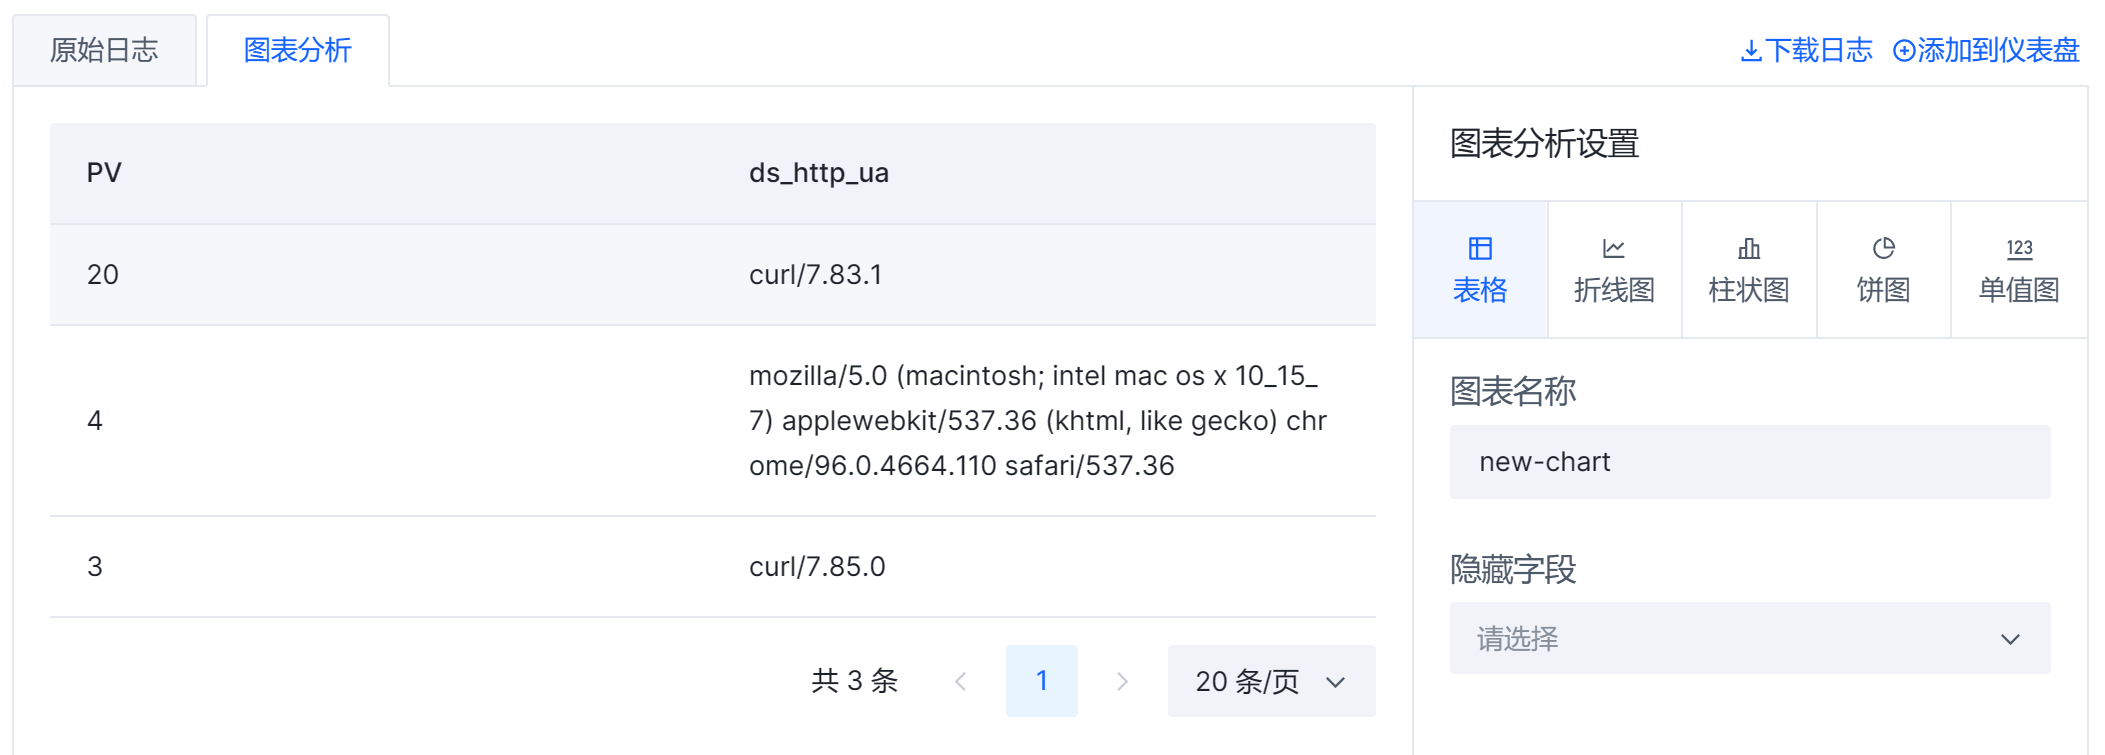
统计独立客户端 IP 地址的数量趋势
需求:
- 在指定的时间区间内,以 5 分钟粒度对独立客户端 IP 地址数量进行统计。5 分钟是 300000 毫秒。
检索语法:
* |select __time__ - __time__ % 300000 as time,COUNT(DISTINCT(client_ip)) as PV group by time
检索结果展示:时序图
检索结果的截图如下。